Petroleum Economics Modelling: Project Economics, Portfolio and Business Plan in One System
A petroleum economics system should value every project under every price scenario and participation case at the same time. It should roll the selected projects into a portfolio and turn that portfolio into the business plan, without copying a single spreadsheet. We build these systems in Quantrix for oil and gas companies, energy investors and consultants. The method was presented at the SPE Annual Technical Conference in Houston (SPE-174768-MS) and was implemented at RAG in Austria.
We have evaluated exploration and production projects in Germany, Austria, Hungary, Poland, Romania, Azerbaijan, Georgia and Ukraine, under concessions, production sharing agreements, service contracts and joint ventures.
Why do spreadsheets break in petroleum economics?
Because the cases multiply. Each project needs several price paths, several participation cases (100% project, company share, farm-down, partner view) and often more than one contract model. In the example from the SPE paper, four price scenarios, eight project cases and three participation cases make 96 economic cases in one summary table. The paper’s example uses hypothetical data.

In a spreadsheet, the NPV formula for that table is copied 96 times, and the table as a whole needs 1,056 formulas. In the multidimensional model it needs 11. Every copied formula is a place where one case can quietly differ from the others.

The workflow suffers too. In the planning cycle described in the paper, each stage took several weeks:
- The business plan started from last year’s plan, without a portfolio analysis.
- Input data was copied between files in different formats.
- Project economics, the portfolio summary and the business plan were not linked.
- A new scenario meant tracing data back through several files and re-running each of them.
How is the system structured?
Three linked modules follow the company’s decision process: evaluate each project, select the portfolio, prepare the business plan.
| Module | What it calculates | What decision-makers get |
|---|---|---|
| Project economics | Work programme and production, capital investment, operating cost, royalty and tax, cash flow, P&L, acquisition and divestiture terms | NPV, IRR, payout, maximum exposure and EMV for every price path and participation case at once; delay sensitivities; forward economics from any start year |
| Portfolio | Production forecast, drilling programme and economics of the selected projects; per-BOE indicators such as netback, capital intensity, finding and development cost and OPEX; government and contractor take | Projects switched on and off, ranked, and measured by their impact on the total; checks against production, reserves and EBIT targets and against rig and budget constraints |
| Business plan | Capital budget, cash flow, P&L and EBIT, work programme and production reports for the selected portfolio, by country and region | Reports in the company’s own format; comparison of plan versions and of plan against actuals |

How are the assumptions organised?
In three levels, so that each number is entered once and owned by the right person:
- Global: oil and gas prices, exchange rates, inflation, discount rate. Identical across the company, controlled centrally through a database link and updated once a year.
- Country: taxes, royalty and other fiscal terms. Entered once per country and reviewed yearly.
- Project: production profile, CAPEX, OPEX, price discount and other technical and commercial data.
The calculation matrices accept no manual entries, so nobody can overwrite a formula with a number. Results are pushed to an SQL database, and the portfolio module reads them from there.

Which fiscal terms and deal structures can it handle?
Because the structure is built for your contracts rather than taken from a template, non-standard terms are modelled directly:
- Royalty and tax concessions with country-specific rates
- Production sharing agreements
- Service contracts with production- and price-dependent fees
- Joint ventures with partner carry, evaluated from our view and the partner’s view side by side
- Farm-in and farm-out deals: the maximum acquisition payment and the sales value of a share
- Gas-to-power options and specific fiscal terms
Can a reviewer read the formulas?
Yes. Formulas use names instead of cell addresses and sit outside the data. The annual cash flow reads:
Cash flow = Revenues - CAPEX - OPEX - Royalty - Taxes
That one formula applies to every project, price scenario and participation case. Add a new project or a new price scenario and it is calculated immediately in the cash flow, the P&L, the economics and the portfolio, because those matrices share the same dimensions.
How is risk handled?
- Price scenarios: low, medium and high paths, or as many as you need, calculated side by side.
- Delays and cost overruns: drilling and production delays, volume and cost changes as quick what-if cases.
- Expected monetary value: a simple decision tree for exploration projects, with several field-size cases, solved across price scenarios and participation cases.
The aim is a clear recommendation for the decision-maker: which alternative has the highest value, and what drives it.

Does the same approach work for power and renewables?
Yes. The dimensions change, the method does not. A recent example: five solar projects in five countries over 25 years, with PPA and merchant revenue, carbon revenue, country-specific tax rates, five scenarios and three financing structures carried as their own dimension. That model was generated from a plain-language brief with our AI Quantrix model builder. Another one you can get with the free Quantrix trial: our renewable energy portfolio model, with offshore and onshore wind, solar PV, battery storage and green hydrogen projects.
Who is this for?
- Small and mid-size E&P companies that have outgrown spreadsheets but do not want an expensive enterprise system
- Economics, portfolio and planning teams preparing investment decisions and business plans
- Business developers screening acquisitions, farm-ins and divestitures
- Energy consultants and investors who evaluate projects under many fiscal regimes
How do we work with you?
- Review: we look at your current economics model and decision process.
- Pilot: one project, or one country portfolio, built in Quantrix with your fiscal terms. Most models are delivered within three weeks.
- Handover: training so your team owns, changes and extends the model.
Frequently asked questions
Can the model connect to our database?
Yes. In the RAG system, global assumptions are read from an SQL Server database and project results are written back to it through a JDBC connection. The portfolio module builds on that data.
How is this different from packaged economics software?
Packaged software comes with fixed templates. Here the structure follows your fiscal terms, your assumption hierarchy and your reporting, and your own team can change it. The formulas stay readable, so there is no black box.
What software do we need?
Quantrix Modeler, a desktop application, and optionally Quantrix Qloud for sharing models. See licences, pricing and the free 30-day trial.
Who builds the model?
Tahir Tahirov, petroleum economist and Authorized Quantrix Trainer and Consultant, with more than 20 years in petroleum economics, portfolio and planning systems. He was Economics and Portfolio Manager at RAG and is the author of SPE-174768-MS.
Try it on a working model
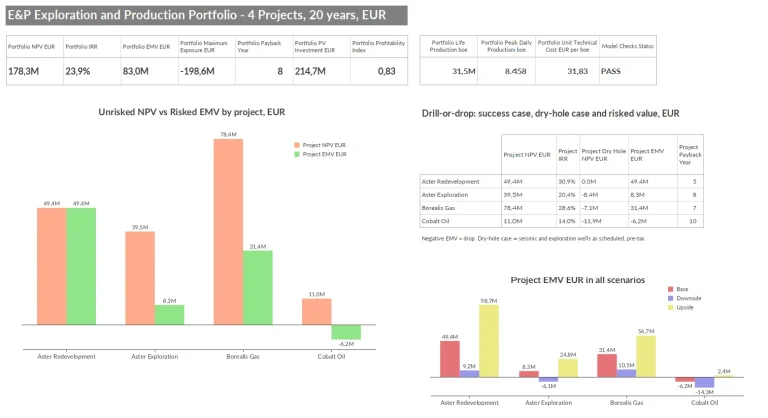
Request the free 30-day Quantrix trial and we will send you our oil and gas economics model with it: four E&P projects over 20 years and three scenarios, with working interest, chance of success and a dry-hole case, rolled up into a portfolio with NPV, IRR and EMV. All names and figures in the model are fictitious. If you want to discuss your own project, write it in the message field.
Get Full Access to Quantrix – Free for 30 Days
We ask for a few details to send your download link and help you get started. Your info stays private, no spam, no credit card.
Why It is Worth Your Time: