
Excel Alternative For Large Data Sets
Excel Too Large and Slow? Discover how Quantrix handles large, complex, multi‑scenario models

Reasons to Replace Excel with Quantrix
Write Logic, Not Cell Coordinates
With Quantrix, you can write formulas in natural language instead of Excel formulas with cryptic cell coordinates. This makes your formulas easy to understand and audit.
Autocomplete helps you write formula faster. You have access to all the functions that Excel offers and more.
Goodbye Formula Chaos
In Quantrix, you do not place formulas inside each cell. You write the formula once, separately, and it applies across the matrix.
In the video, one formula calculates the gross margin percentage for every Port, Year, Month, and for both Actual and Plan data. This eliminates the need to write thousands of formulas as in Excel, which is a major advantage for large models.
From 128 Sheets to 1 Matrix
Quantrix Modeler lets you work with truly multi‑dimensional data — with always‑on pivoting that lets you slice, dice, and reshape data instantly. The single matrix shown on video, for example, replaces 128 Excel sheets, eliminating complexity and errors.
Quantrix is designed for high‑complexity, multi‑scenario models that would be difficult or unstable in spreadsheets.
No Copy‑Paste. No Errors.
Quantrix matrices have a connected structure. This example shows how adding a new Special Scenario in Assumptions automatically updates the Sales report.
You do not need to copy and paste items from one table to another like in Excel. This keeps your model structure consistent and error-free.
Big Models, Small Files
With Quantrix, you can work with millions of cells in one model without compromising speed or accuracy. Quantrix files are much smaller than Excel files for the same calculation. Plus, you can easily create and manage different scenarios or versions of your model and keep them all in one file.
Quantrix is the ultimate tool for complex calculations and data analysis.
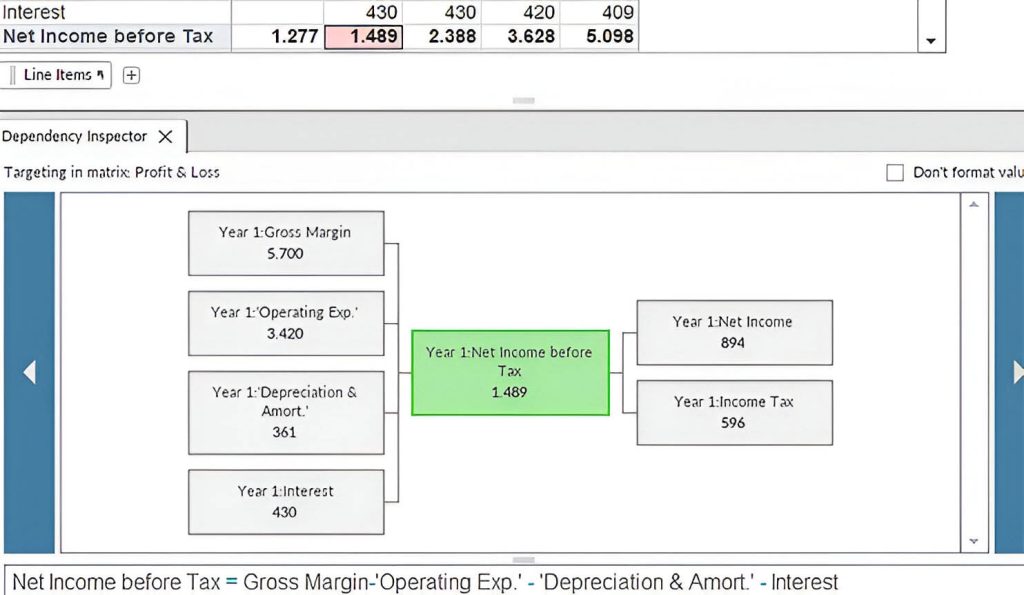
Clear, Transparent Calculations
With the Dependency Inspector tool, you can easily see how each cell in your model is calculated and understand the logic behind it. This tool helps you to present your model confidently at your business meetings and explain how the numbers are derived.
The Dependency Inspector tool is a powerful feature that enhances the transparency and accuracy of your model.
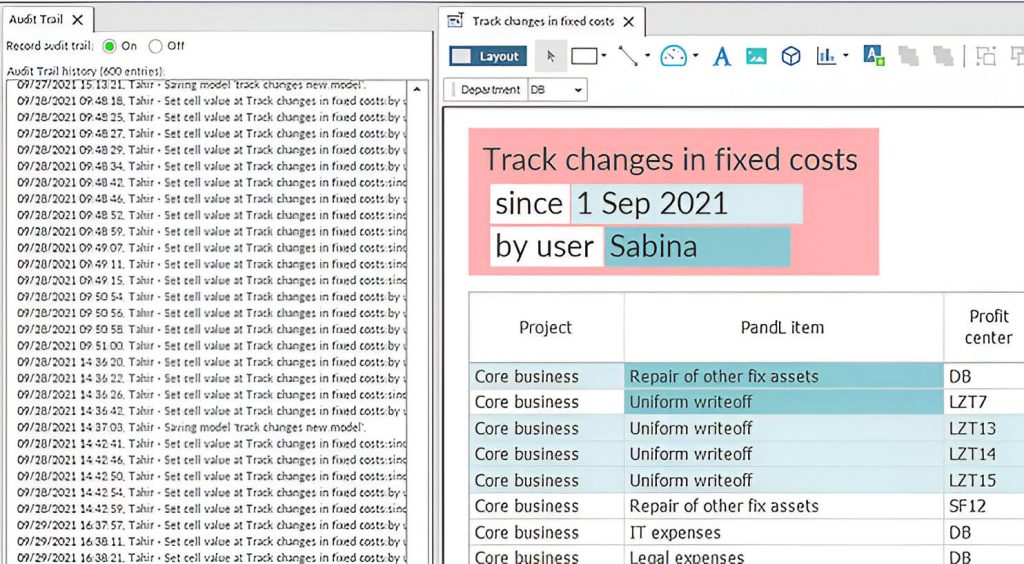
Know Every Edit in Your Model
In Quantrix desktop app you can easily see who did what and when on your model.
Audit Trail tool records all changes to data and structure, so you can always go back and review them. Plus, you don’t have to worry about documenting of changes to your model, because it is done automatically. This is especially important if you are working on a shared model.
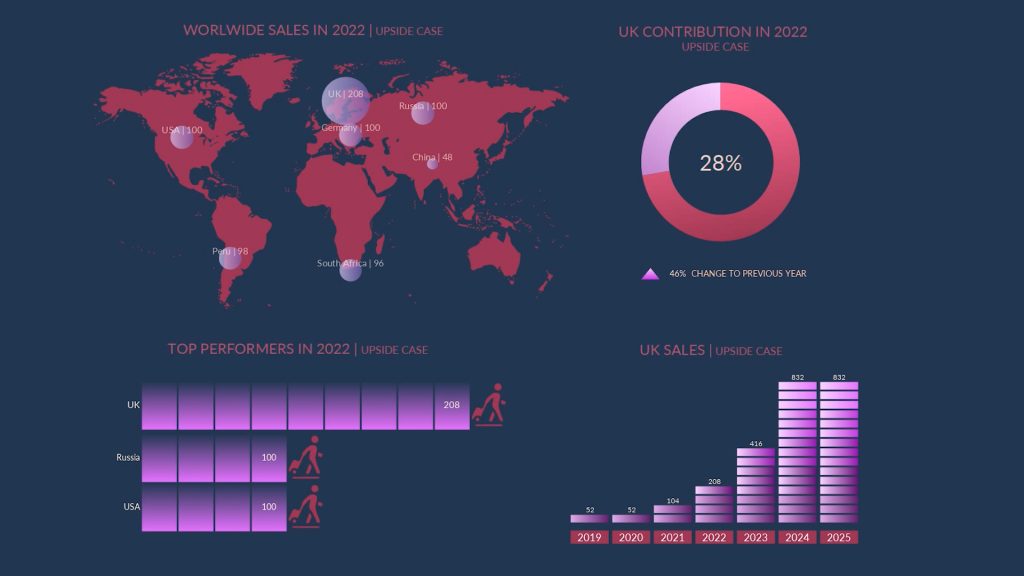
Visualize. Present. Impress.
You can create amazing dashboards and reports with Presentation canvas. Just add your chart, data, images, interactive sliders and other widgets to the canvas and customize them.
With Presentation canvas, you can tell the story of your data in a visually appealing way that will impress your audience.
Showcase of Quantrix Models


Frequently Asked Questions about Quantrix Modeler
Get Full Access to Quantrix – Free for 30 Days
We ask for a few details to send your download link and help you get started. Your info stays private, no spam, no credit card.
Why It is Worth Your Time: