
Renewable Energy Portfolio Model in Quantrix: Wind, Solar, Storage and Hydrogen
This renewable energy portfolio model values five projects in five European countries, side by side, over 25 years and under five scenarios: offshore wind, onshore wind, solar PV, battery storage and green hydrogen. It is built in Quantrix and you can get it free with the 30-day Quantrix trial. All names and figures in the model are fictitious.
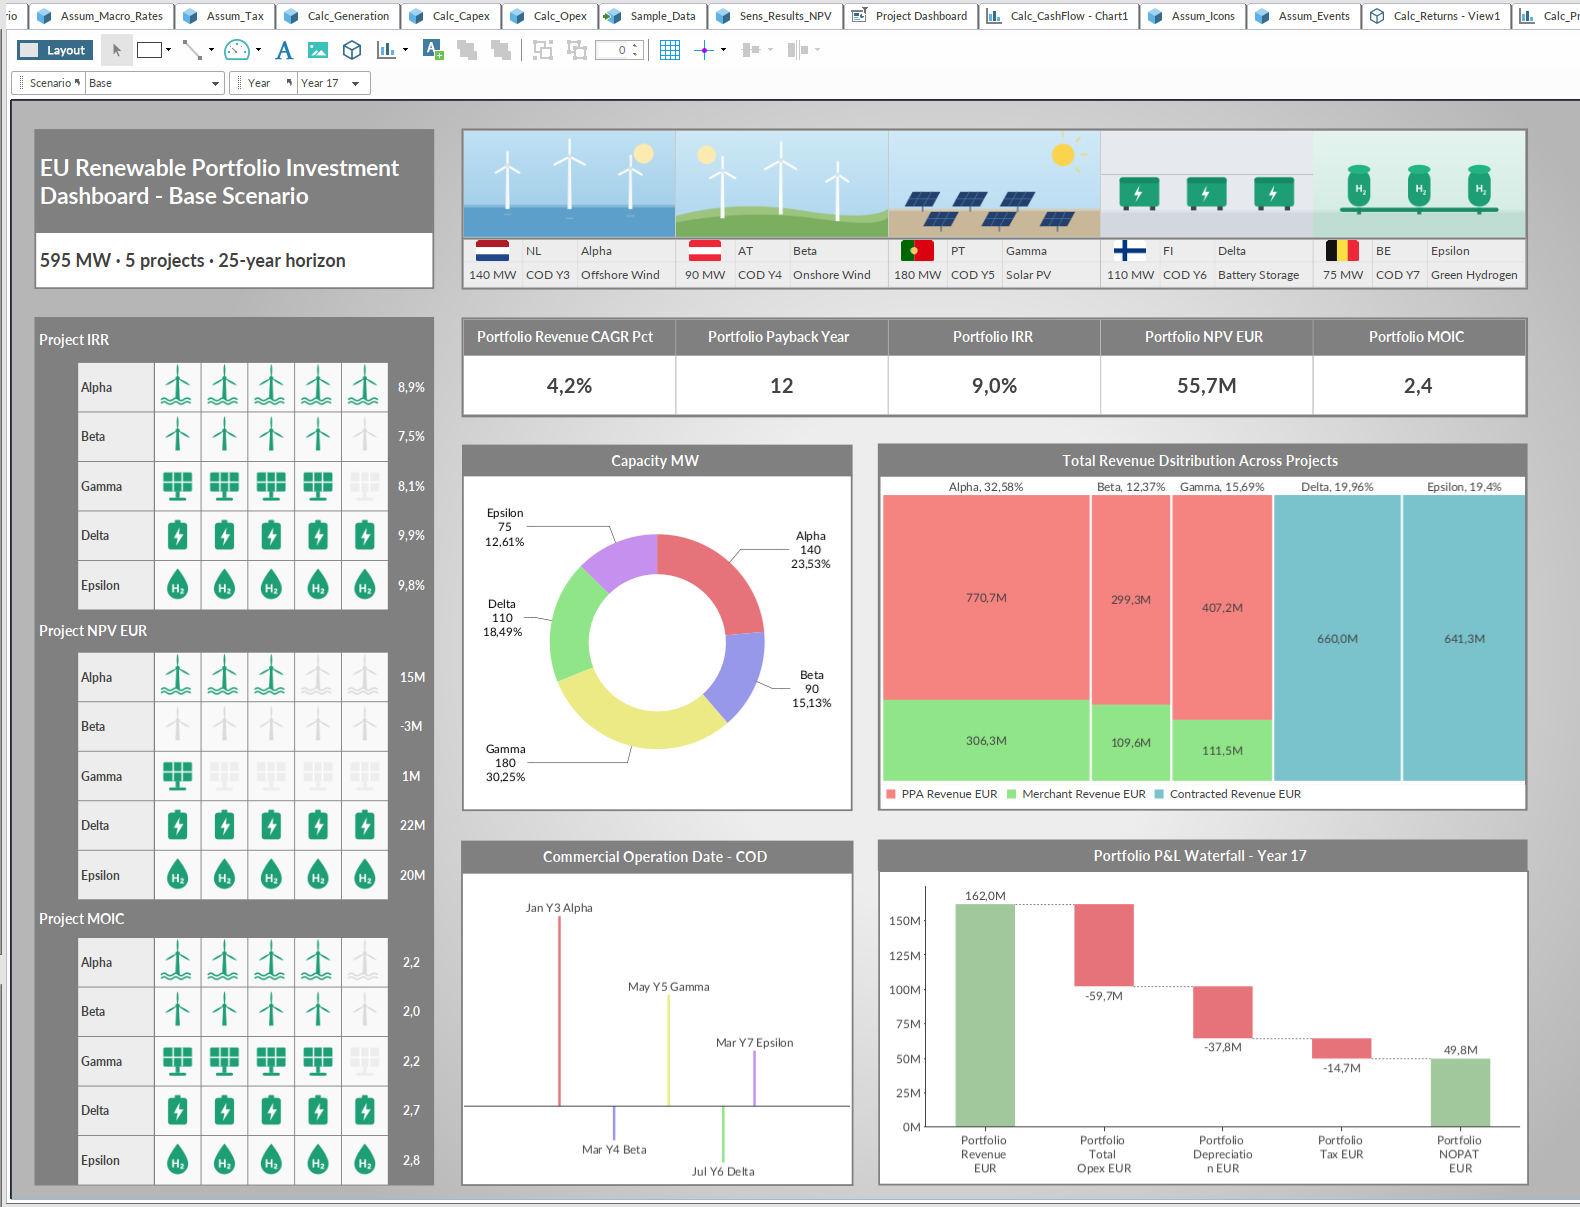
What is in the model?
| Project | Technology | Country | Capacity | Revenue model |
|---|---|---|---|---|
| Alpha | Offshore wind | Netherlands | 140 MW | PPA, merchant and carbon revenue |
| Beta | Onshore wind | Austria | 90 MW | PPA, merchant and carbon revenue |
| Gamma | Solar PV | Portugal | 180 MW | PPA, merchant and carbon revenue |
| Delta | Battery storage | Finland | 110 MW | Contracted revenue per MW |
| Epsilon | Green hydrogen | Belgium | 75 MW | Contracted revenue per MW |
Each project has its own commercial operation year, so the portfolio builds up over time. The model runs 25 years and five scenarios: Base, Power Price Downside, Capex Stress, Combined Stress and Upside.
Which assumptions can you change?
- Generation: specific yield and annual degradation
- Revenue: PPA price and PPA tenor, merchant power price, contracted revenue per MW for storage and hydrogen, carbon price and carbon intensity
- Capex: annual capex by project, with a capex overrun percentage by scenario
- Opex: O&M, land lease, grid connection, insurance and asset management fee per MW, plus a major maintenance reserve
- Macro and tax: inflation, corporate tax rate by country, project and portfolio discount rates
- Scenarios: a power price adjustment and a capex overrun per scenario, applied across all projects
What does it calculate?
- generation, revenue by type, opex, EBITDA, depreciation, tax and NOPAT for each project and year
- unlevered free cash flow and cumulative cash flow
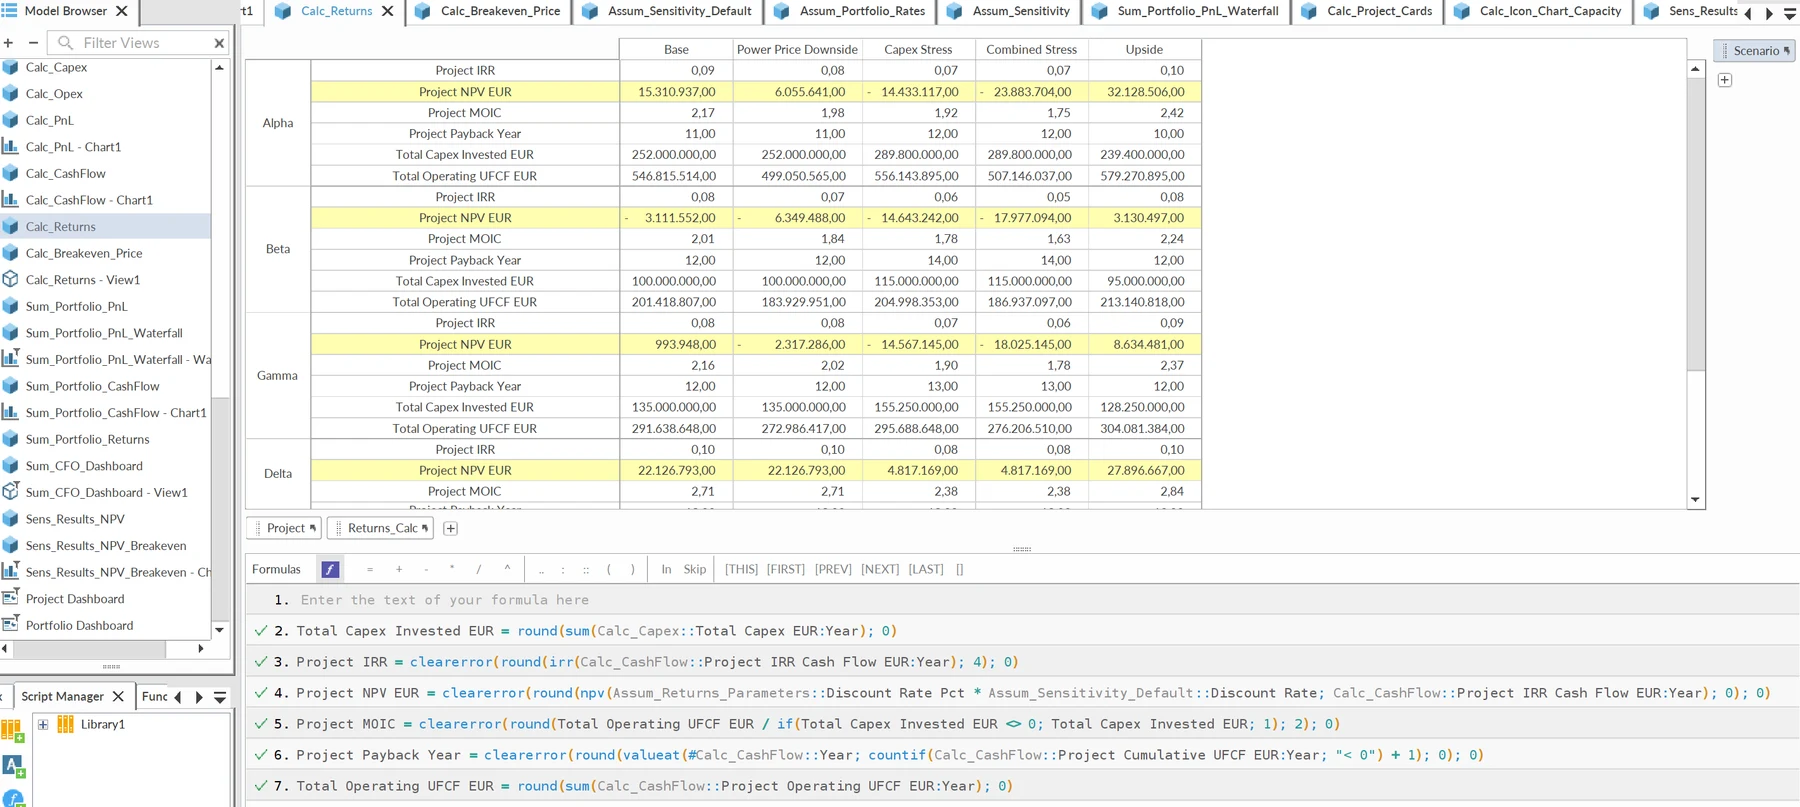
- project and portfolio IRR, NPV, MOIC and payback year
- a CFO dashboard with the portfolio KPIs and every project’s returns, for each scenario
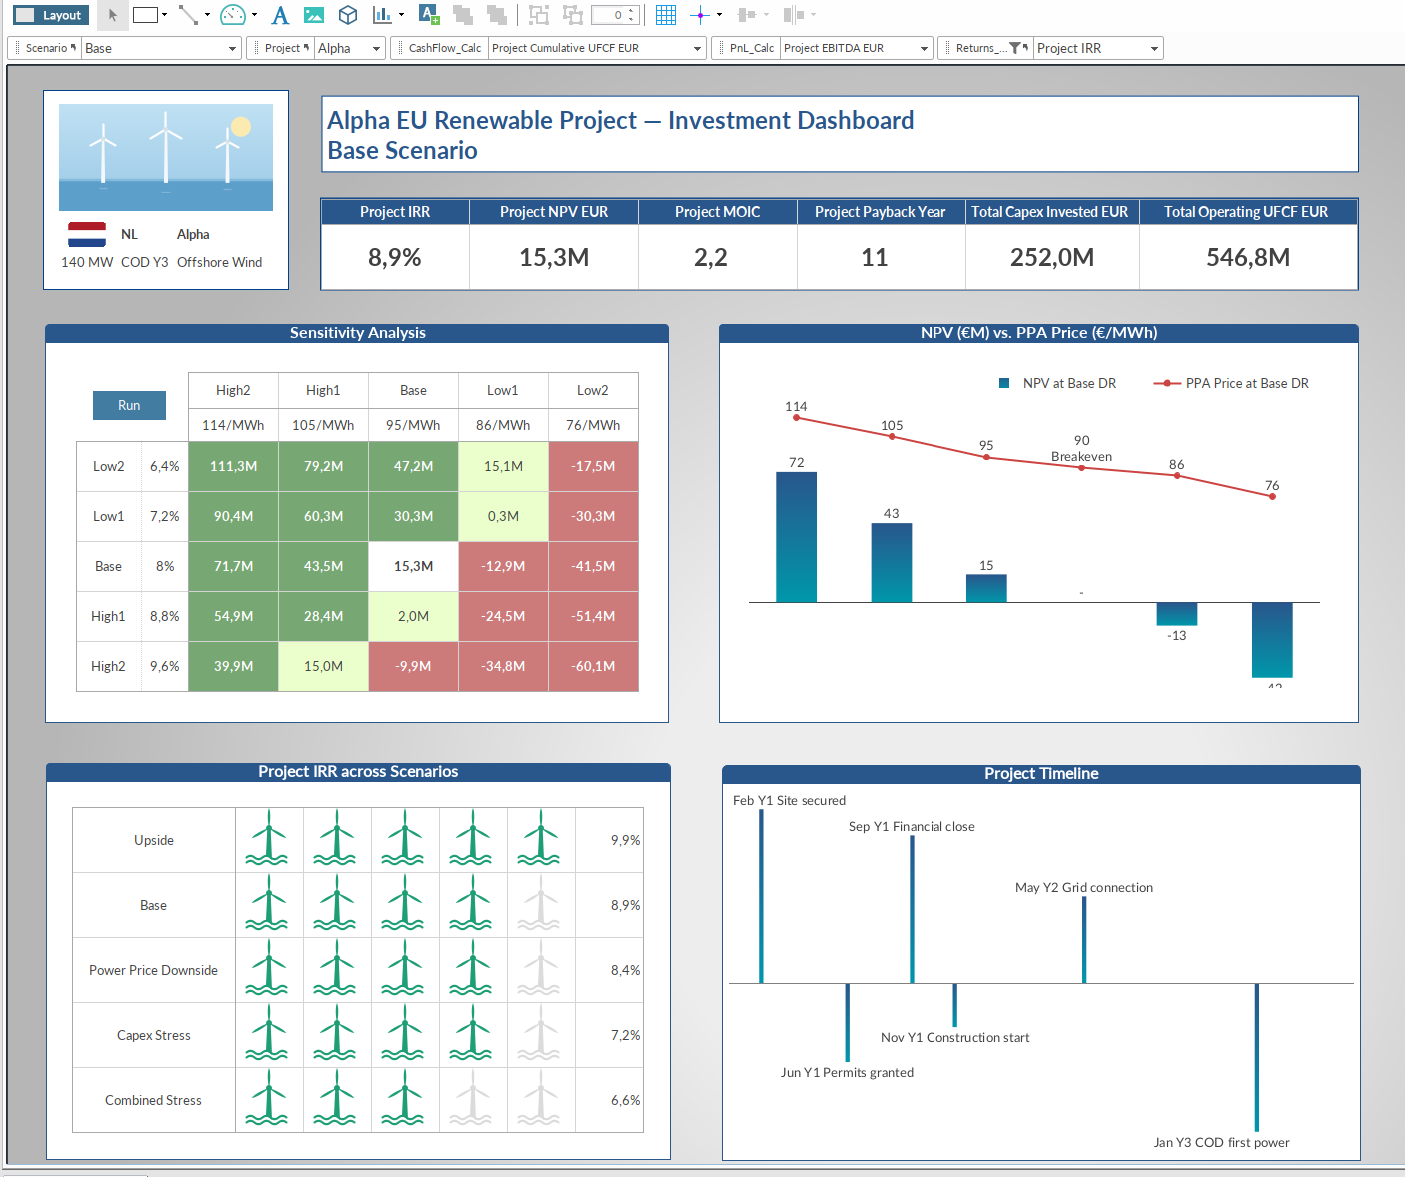
- an NPV sensitivity grid: PPA price against discount rate, five steps each, for every project
Why build this in Quantrix rather than Excel?
Five projects, five scenarios and 25 years make 625 project-scenario-years before a single cost line is added. In a spreadsheet that means copied blocks per project and per scenario. In Quantrix, each formula is written once and applies to every project, scenario and year. Adding a sixth project, a new country or another scenario means adding one item; every calculation, total and dashboard picks it up.
How was this model built?
It was generated from a plain-language brief with our AI Quantrix model builder and then reviewed and tested. The same method builds a model around your own projects, technologies and contract terms.
What the model does not include
- debt financing: the returns are unlevered. Project finance with debt sizing, DSCR and LLCR is a separate model
- detailed technical yield modelling: generation is driven by specific yield and degradation
- real project data: all names and figures are fictitious
Get the model with your free trial
Request the free 30-day Quantrix trial below and we will send you this renewable energy portfolio model with the download link. If you would like it adapted to your own portfolio, say so in the message field.
Get Full Access to Quantrix – Free for 30 Days
We ask for a few details to send your download link and help you get started. Your info stays private, no spam, no credit card.
Why It is Worth Your Time:
Frequently asked questions
Do I need Quantrix to open the model?
Yes. The model is a Quantrix Modeler file. The 30-day trial is free and we send the model with it. See licences and pricing.
Can I change the technologies, countries or number of projects?
Yes. Projects, countries and scenarios are dimensions of the model. Adding or renaming one updates every calculation, total and report.
Can you build a version for our own portfolio?
Yes. Send a short description of your projects, revenue contracts and the reports you need. See the AI model builder or our petroleum and energy economics work.
Is any of the data real?
No. Project names, capacities, prices and costs are fictitious and only illustrate how the model works.


