
Oil and Gas Economics Model in Quantrix: NPV, EMV and Dry-Hole Risk for Four E&P Projects
This oil and gas economics model values four exploration and production projects side by side, over 20 years and under three scenarios: one oil field redevelopment and three exploration prospects, two for oil and one for gas. It weighs each prospect by its chance of success against the cost of a dry hole. It is built in Quantrix and you can get it free with the 30-day Quantrix trial. All names and figures in the model are fictitious.
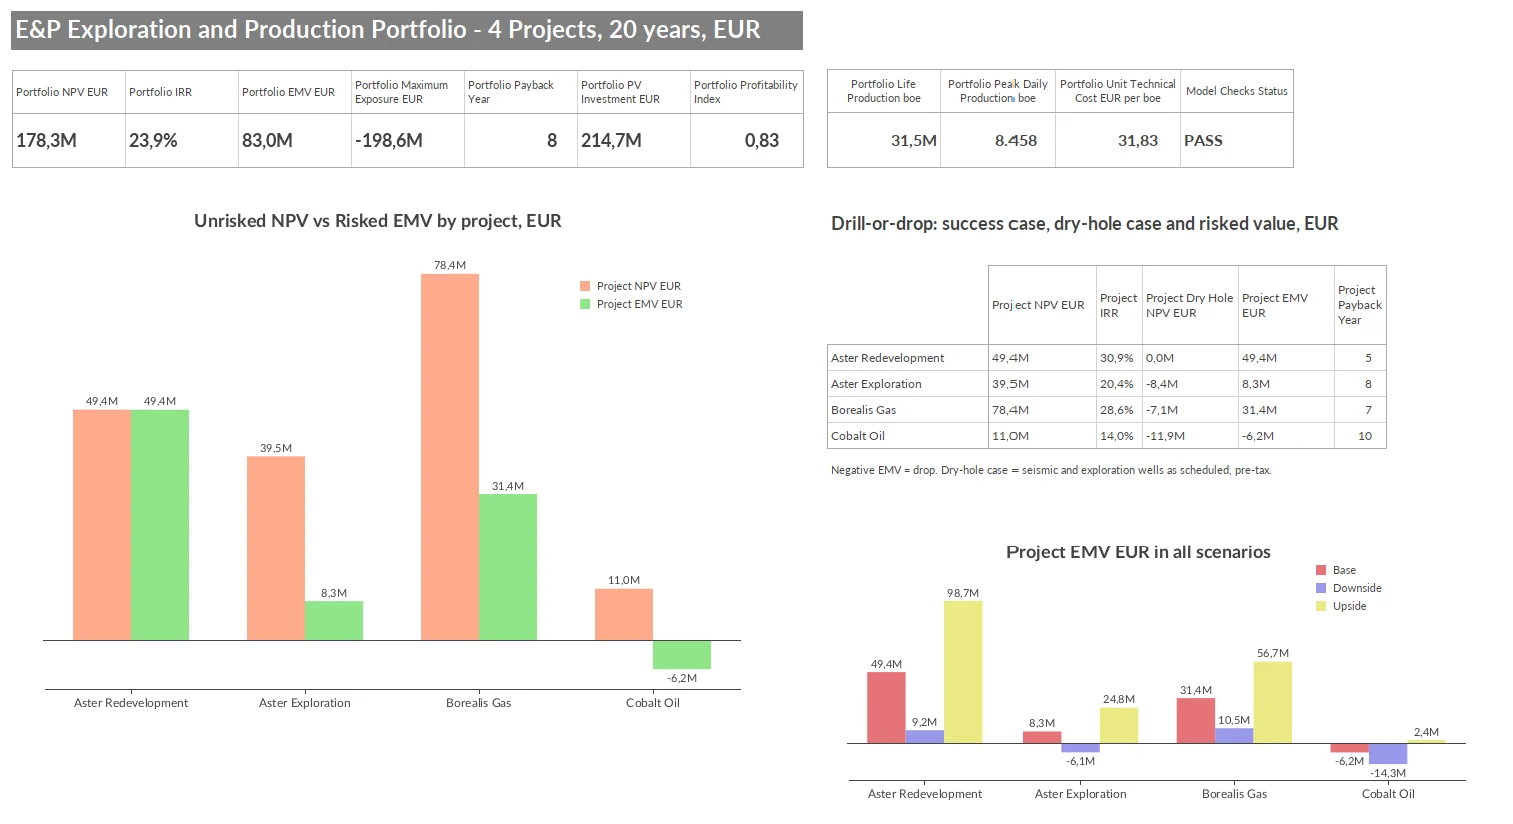
What is in the model?
| Project | Type | Working interest | Chance of success | First production |
|---|---|---|---|---|
| Aster Redevelopment | Oil field redevelopment | 70% | 100% | Year 2 |
| Aster Exploration | Oil exploration | 70% | 35% | Year 5 |
| Borealis Gas | Gas exploration | 50% | 45% | Year 5 |
| Cobalt Oil | Oil exploration | 60% | 25% | Year 6 |
All results are net to the company’s working interest, in euros. The model runs 20 years and three scenarios. Downside lowers oil and gas prices by 15%, raises capital costs by 10% and operating costs by 5%, and reduces production and reserves. Upside raises prices by 15%, lowers capital costs by 5% and increases production and reserves.
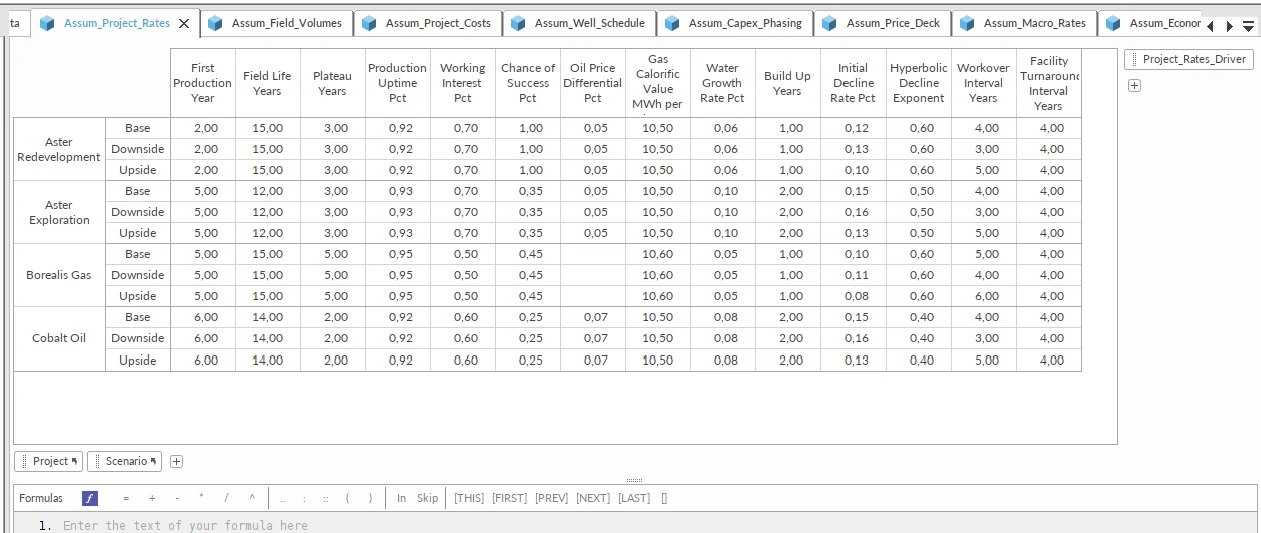
Which assumptions can you change?
- Production: first production year, field life, build-up and plateau years, oil and gas plateau rates, hyperbolic (Arps) decline, uptime, water production and recoverable reserves
- Wells and capital: a yearly schedule of exploration, development and injection wells with cost per well; seismic, facilities and pipeline budgets with yearly phasing; abandonment cost
- Operating costs: fixed opex, variable opex per boe, water handling, oil and gas transport tariffs, well workovers based on average run life, and facility turnarounds on a fixed interval
- Prices and macro: Brent in USD, gas price in EUR per MWh, oil price differential, EUR/USD rate and cost inflation
- Fiscal terms and risk: oil and gas royalty, corporate tax rate, loss offset limit, discount rate, and the working interest and chance of success of each project
- Scenarios: every assumption can take a different value in Base, Downside and Upside
What does it calculate?
- gross and net oil, gas and water production, and production in barrels of oil equivalent
- revenue, royalty, operating costs, capital costs and abandonment for each project and year
- successful-efforts accounting: seismic is expensed, wells and facilities are capitalised and depreciated by unit of production
- corporate tax ring-fenced per project, with a loss pool and a limit on loss offset
- net and cumulative cash flow, maximum exposure and payback year
- NPV, IRR, profitability index and unit technical cost per boe
- dry-hole NPV and expected monetary value (EMV) for each exploration prospect
- a control layer that checks cash flow, production, depreciation and capex phasing in every scenario
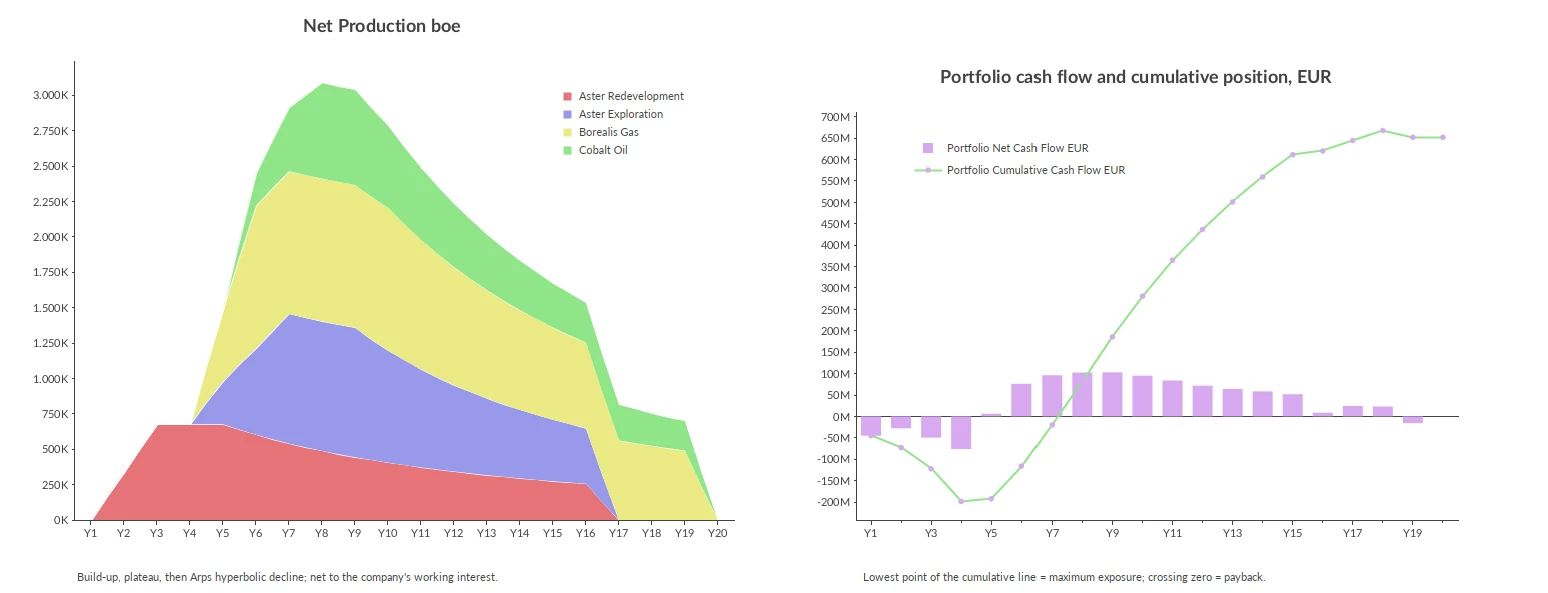
What does the oil and gas economics model show?
Unrisked NPV says develop all four projects: at a 10% discount rate they are worth €178.3 million together, with a maximum exposure of €198.6 million and payback in year 8. EMV weighs each exploration prospect by its chance of success against the cost of a dry hole, and on that basis the portfolio is worth €83.0 million.
Cobalt Oil shows the difference. If it succeeds, it is worth €11.0 million. With a 25% chance of success and a dry hole costing €11.9 million in present value, its EMV is −€6.2 million: a project worth developing if found, but not worth drilling. In the Downside scenario the risked value of the whole portfolio falls to about zero (−€0.7 million), and only the Upside scenario makes Cobalt Oil worth drilling (€2.4 million).
Why build this in Quantrix rather than Excel?
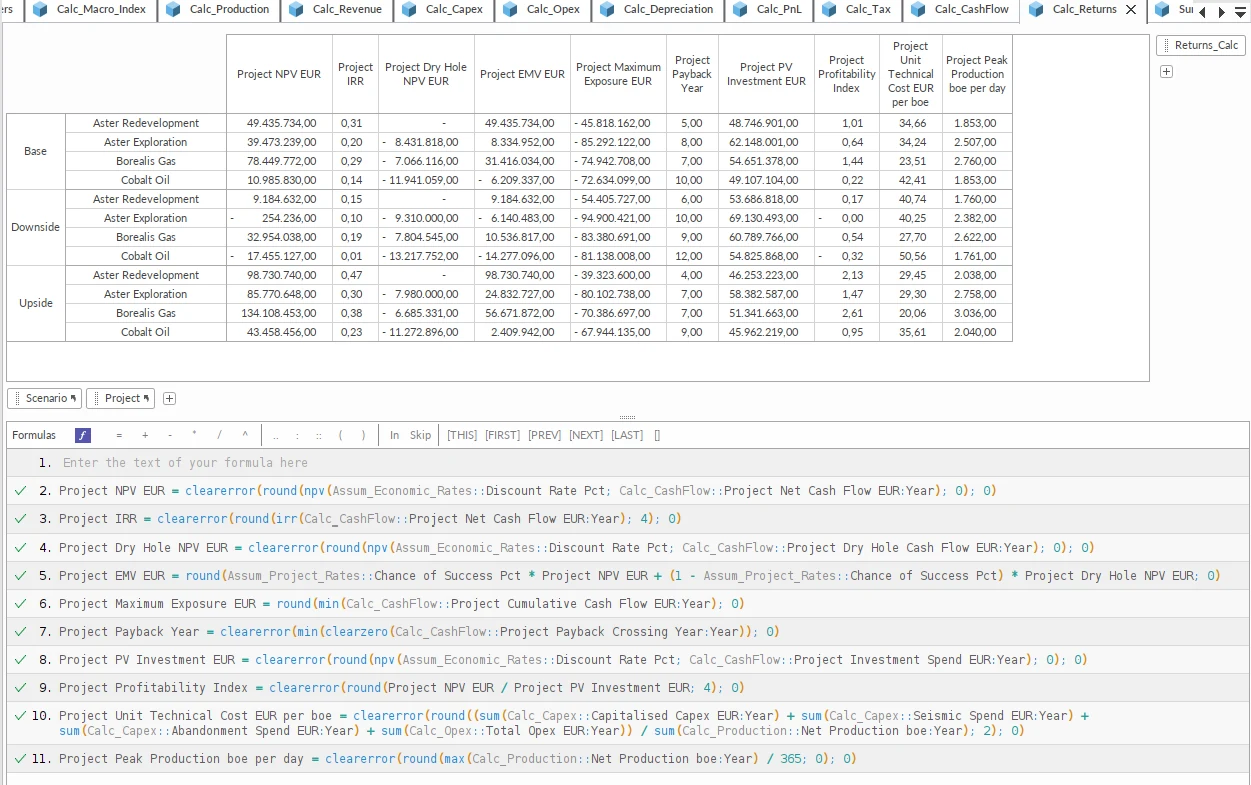
Four projects, three scenarios and 20 years make 240 project-scenario-years, and every exploration prospect needs a dry-hole case next to its success case. In a spreadsheet that means copied blocks per project and per scenario. In Quantrix, each formula is written once and applies to every project, scenario and year: the EMV formula below calculates all twelve project-scenario combinations. Adding a fifth prospect or another price scenario means adding one item; every calculation, total and dashboard picks it up.
How was this model built?
It was generated from a plain-language brief with our AI Quantrix model builder and then reviewed and tested. The same method builds a model around your own projects, fiscal terms and reports. How project economics, portfolio and business plan work together in one system is described on our petroleum economics modelling page and in the RAG case study.
What the model does not include
The demonstration model keeps one fiscal regime and an equity-funded view so the logic stays easy to follow. Each of the following can be added when we adapt the model to your projects:
- production sharing agreements and service contracts, alongside or instead of the royalty and corporate tax concession used here
- debt financing and a balance sheet; the projects are currently equity-funded
- partner views and participation cases, such as 100% project, company share and farm-down; results are currently net to one working interest per project
- terminal value and working capital
- production profiles from your reservoir engineers, imported in place of the build-up, plateau and decline curve
- your own project data in place of the fictitious names and figures
Say which of these you need in the message field of the trial form below.
Get the model with your free trial
Request the free 30-day Quantrix trial below and we will send you this oil and gas economics model with the download link. If you would like it adapted to your own projects or fiscal terms, say so in the message field.
Get Full Access to Quantrix – Free for 30 Days
We ask for a few details to send your download link and help you get started. Your info stays private, no spam, no credit card.
Why It is Worth Your Time:
Frequently asked questions
Do I need Quantrix to open the model?
Yes. The model is a Quantrix Modeler file. The 30-day trial is free and we send the model with it. See licences and pricing.
Can I change the projects, fiscal terms or scenarios?
Yes. Projects and scenarios are dimensions of the model, so adding or renaming one updates every calculation, total and dashboard. Royalty, tax rate, loss offset limit and discount rate are inputs for each scenario.
Can you build a model for our fiscal regime, for example a production sharing agreement?
Yes. Production sharing agreements, service contracts and joint ventures with partner carry are part of our petroleum economics modelling work. Send a short description of your projects and contract terms.
Is any of the data real?
No. Project names, volumes, prices and costs are fictitious and only illustrate how the model works.


