RAG Case Study: One System for E&P Project Economics, Portfolio and Business Plan
RAG, an Austrian energy company, replaced the spreadsheets behind its international exploration and production planning with one connected system in Quantrix. It values each project, builds the portfolio and produces the business plan from the same data. Tahir Tahirov built it while working at RAG as Economics and Portfolio Manager; today he is director of Smart Modeling Solutions. He presented it at the SPE Annual Technical Conference in Houston in 2015 (SPE-174768-MS).
| Before | After | |
|---|---|---|
| Planning cycle | Several weeks per stage | Scenarios and portfolio changes calculated directly in the system |
| Link between models | None between economics, portfolio and business plan | Project results flow to a SQL database; portfolio and business plan read from it |
| Formulas for the economics summary | 1,056 in a spreadsheet | 11 |
| Business plan basis | Last year’s plan, no portfolio analysis | The portfolio selected from current project economics |
| Adding a project or price scenario | Update every sheet, formula and chart | Add one item; every matrix picks it up |
What was the problem?
The international E&P unit planned its business in a cycle where each stage took several weeks:
- Building the models: the business plan started from last year’s plan, without a portfolio analysis. Input data came from spreadsheets and other software, copied between files in different formats. Project economics, the portfolio summary and the business plan were not linked.
- Management review: little room for what-if analysis and no portfolio view. The plan was consolidated at corporate level by finance, so decisions drifted toward accounting measures such as P&L and EBIT rather than project value.
- Every update: trace data back through several files, change the assumptions in each, copy the results into summary files and recalculate.
The root cause was spreadsheet modelling inside an unstructured, non-interactive workflow. Every price scenario, contract model and participation case multiplied the number of copied formulas, and with them the places where an error could hide.
What did RAG want from the new system?
- a standard structure for every project model
- scenarios and simulations built in minutes, inside the model
- no formula errors, and models that are transparent and easy to audit
- room for non-standard projects: gas-to-power, production sharing agreements, complex farm-in and farm-out deals, specific fiscal systems
- a database and a smooth data flow between economics, portfolio and business plan
- portfolio analysis independent of the corporate structure and the accounting view
- far less time spent preparing and updating data
What was built?
Three connected modules that follow the company’s decision process: value each project, select the portfolio, prepare the business plan.
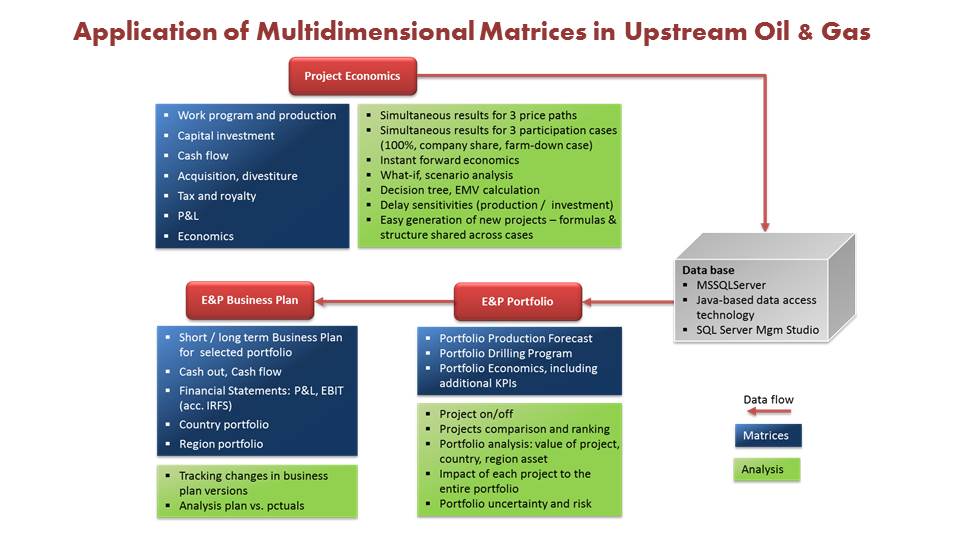
- Project economics: the central module. Inputs and calculations are kept apart, and assumptions sit at three levels: global prices and rates from the database, country fiscal terms, and project data. It calculates NPV, IRR, payout, maximum exposure and EMV for every price scenario and participation case, the maximum price for a farm-in and the sale value for a farm-out, and the effect of drilling and production delays. The start year of the economics is an input, so each annual update produces forward-looking economics straight away.
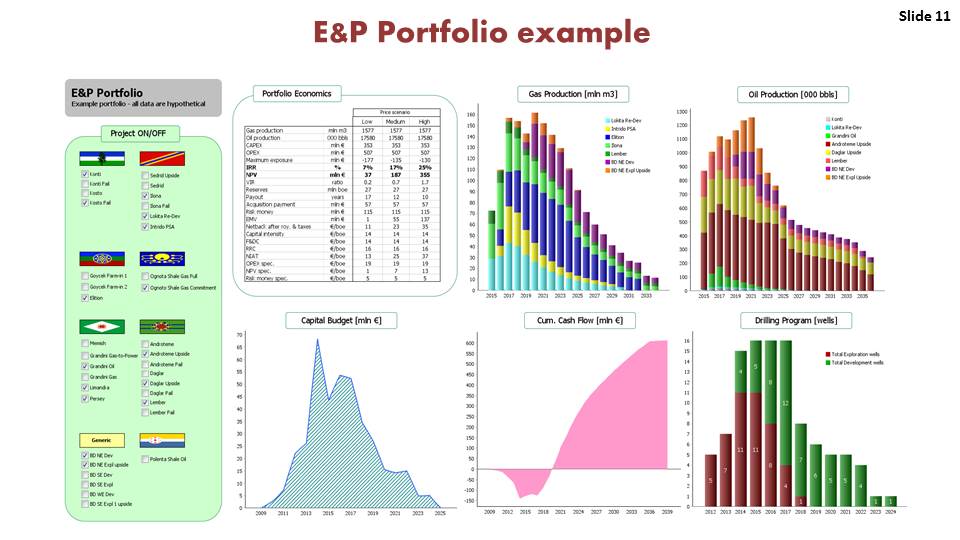
- Portfolio: reads the project results from the SQL database. It adds per-barrel indicators (netback, capital intensity, finding and development cost, OPEX) and government and contractor take, and checks the selected portfolio against production, reserves and EBIT targets and against rig and budget limits. Projects are switched on and off on an interactive canvas, and their effect on the total shows immediately.
- Business plan: produces the capital budget, P&L, cash flow, work programme and production reports for the selected portfolio, in the company’s own format, and compares plan versions.
How each module works, with the assumptions hierarchy and the fiscal terms it handles, is described on our petroleum economics modelling page.
How much simpler did the models become?
In one example from the paper, a mature-field redevelopment with exploration upside offered a farm-in under two contract models: a joint venture with partner carry, or a service contract with a production- and price-dependent fee. With RAG’s view and the partner’s view of each, three working-interest cases and four price scenarios, a single summary table holds 96 economic cases.
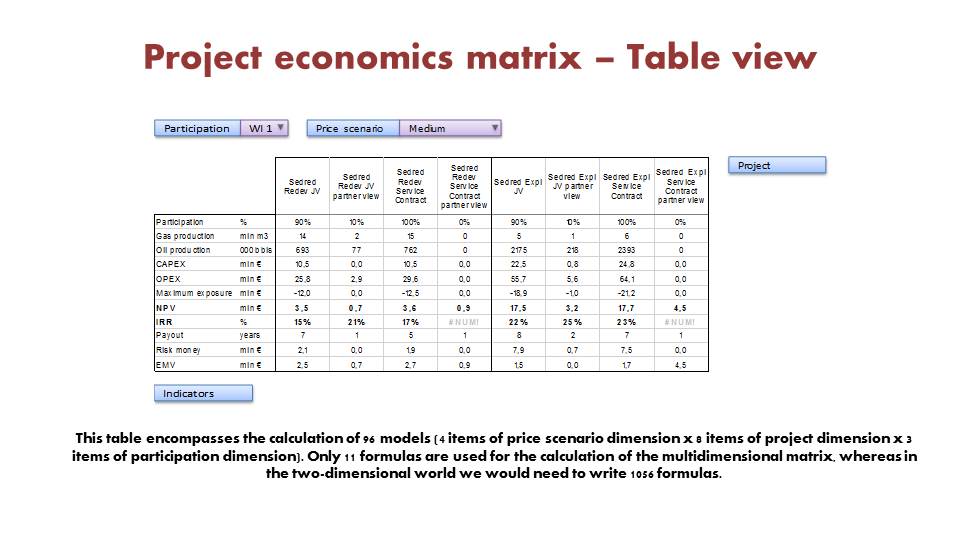
A spreadsheet would need 1,056 formulas for that table. The Quantrix matrix uses 11, written in plain names rather than cell addresses:
Cash flow = Revenues - CAPEX - OPEX - Royalty - Taxes
Because price scenario, project and participation are dimensions shared by the cash flow, P&L and economics matrices, a new price scenario added once appears in all of them. Calculation matrices accept no manual input, so nobody can type a number over a formula.
What changed for the decision-makers?
- Portfolio updates happen on the fly: a new project in the economics module appears in the portfolio, because both use the same dimensions.
- Management sees the effect of each project on the portfolio before deciding, on production, capital budget, cash flow and drilling programme.
- The portfolio and the indicators per barrel act as a check on the models themselves: projects are compared with each other and with market benchmarks such as acquisition cost per barrel of similar assets.
- The system was used as a simulation tool at project and portfolio level, not only for the annual plan.
- Complex acquisitions and divestitures and different fiscal terms in many countries fit into the same structure.
What did it take?
More planning at the start than a spreadsheet. The dimensions are designed first, top-down, and modellers have to think in dimensions rather than cells. That time pays back each time a project, scenario or country is added, because the structure and the formulas do not have to be rebuilt.
For risk, the system stays deliberately simple: four price scenarios without probabilities, and EMV from a single decision node or, for exploration, a small decision tree over several field sizes. The aim was a clear recommendation, which alternative has the highest value and why, rather than precision the data could not support.
Can a smaller company do the same?
Yes. That was the point of the RAG system: a small or mid-size E&P company can get past the limits of spreadsheets without buying an expensive enterprise system. Most pilot models, one project or one country portfolio with your fiscal terms, are delivered within three weeks.
Try it on a working model
Request the free 30-day Quantrix trial below and we will send you our E&P economics demonstration model with the download link. If you want to discuss your own projects or portfolio, write it in the message field.
Get Full Access to Quantrix – Free for 30 Days
We ask for a few details to send your download link and help you get started. Your info stays private, no spam, no credit card.
Why It is Worth Your Time: