Script to change column width of an item or all items
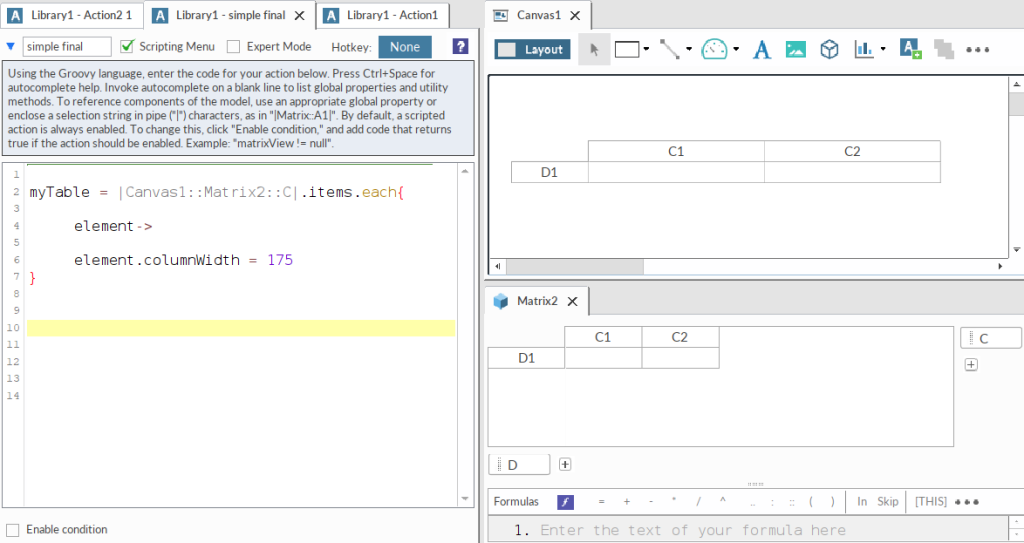
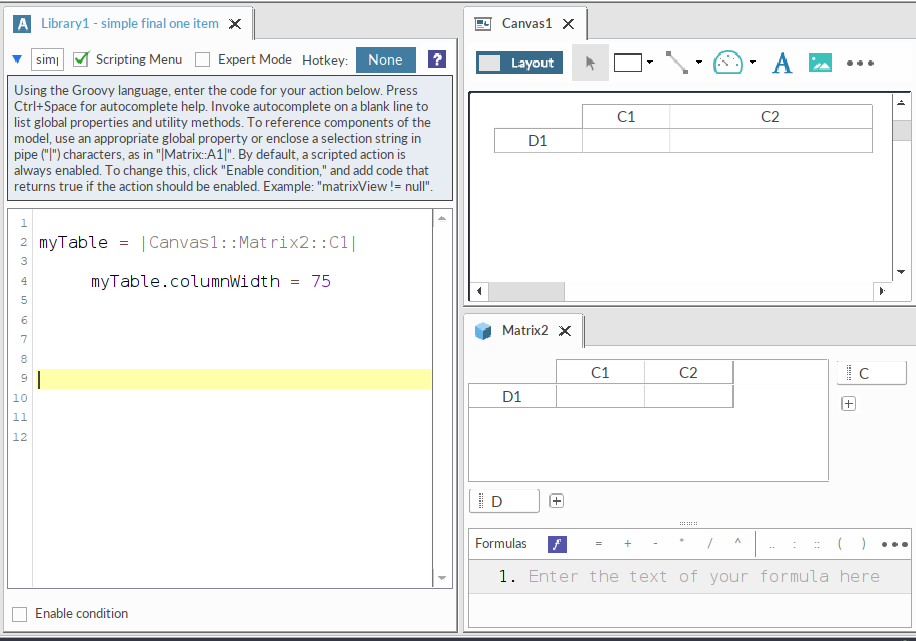
This script designed to change the column width of items.

This script designed to change the column width of items.

This almost 30 years old article promises that Lotus’ Improv for Windows will change the way people create and look at spreadsheets. With Excel dominating the market, these amazing advantages of Lotus Improv are almost forgotten. But they are still valid today.Luckily, we have all these amazing concepts of Lotus Improv in Quantrix for those who want…

Our solution help you to plan and evaluate projects including non-standard terms of Royalty/Tax, Production Sharing Agreements, complex acquisition or divestiture terms, gas-to-power option, etc. You can add different price scenarios, investment size and schedules, production profiles. Whether you acquire or sell assets, our customized app will help you understand the value of the projects…

This article will introduce you a new, innovative way of financial modelling for your planning, budgeting, forecasting needs and running “what-if” analysis with multiple scenarios. Every controller faces complex modelling tasks in his/her daily work. Be ready to sit on driving seat, quickly and efficiently create your financial model. Multidimensional modelling is an alternative to…

We developed budgeting solution for Global Ports Holding Plc, which incorporates various ports operational models across the world. Based on this success Operational Performance tracking module was implemented with the most updated KPI’s and Analytics.

Business forecasting is one of the most important capabilities for any organization that wants to plan effectively, allocate resources wisely, and respond to market changes with confidence. Whether you work in retail, manufacturing, finance, or supply chain management, the ability to predict future demand, revenue, or operational needs can dramatically improve decision‑making. In this guide,…

Watch step-by-step instruction for building a Bullet graph in Quantrix. A bullet graph is a variation of a bar graph that shows progress towards a goal or performance against a reference line. A bullet graph consists of a featured measure (such as current revenue), a reference line (such as a target), and qualitative ranges (such…
We use cookies to improve your experience. You can accept or manage your preferences at any time. Some features may not work properly without consent.