
Excel Alternative for Large Data Sets and Large Models
Excel too slow, or split into dozens of files? Which tool fits which problem, and how large a Quantrix model can get

In short: Excel stops working long before its limit of 1,048,576 rows and 16,384 columns, because every calculated value is a separate formula that has to be stored, recalculated and kept consistent. If your problem is millions of raw records, a database or Power Query is the right tool. If your problem is a planning or financial model with many products, stores, entities, periods and scenarios, Quantrix is built for it: one formula covers every item of every dimension. We built a retail budget with 500 million cells and 127 formulas on a 16 GB laptop; a change recalculated in about 3 seconds.
Is your problem large data or a large model?
The same words, “Excel can’t handle it”, describe two different problems, and they need different tools.
| Your situation | What it looks like | The right tool |
|---|---|---|
| Large raw data | Millions of transactions, logs or CSV exports to filter, join and summarise | A database, Power Query, or a spreadsheet built for big data |
| Large summaries inside Excel | Pivot tables on more rows than a sheet holds | Power Pivot (Excel’s data model) |
| A large model | A budget, forecast or business plan by product, store, entity, month and scenario; dozens of linked sheets; copies for each scenario | A multidimensional modelling tool such as Quantrix |
| A company-wide planning process | Hundreds of contributors, workflows, approvals, ERP integration | An enterprise planning platform, with Quantrix possible as the modelling layer |
The rest of this page is about the third row: models that outgrow Excel.
How big does a model get before Excel struggles?
The detail multiplies. Take an illustrative sales and margin plan with 500 products, 20 regions, 36 months and 3 scenarios: that is 1,080,000 combinations, and each one needs volume, price, revenue, cost and margin, over 5 million calculated values. In Excel that becomes one sheet per region and scenario (60 sheets), linked to summary sheets, with every formula copied into every cell. Each change to a rule must be repeated in every copy.
The usual symptoms:
- The file takes minutes to open or recalculate, so people switch calculation to manual
- The model is split into several files linked together, and links break
- Each scenario is a copy of the workbook, and the copies drift apart
- Adding a product, store or month means inserting rows in many sheets
- Only one person understands the model, and checking it takes days
What does Quantrix do differently?
In Quantrix, products, regions, months and scenarios are dimensions of one matrix, not rows and sheets. A formula is written once, in words, and applies to every combination: Revenue = Volume * Price. Adding a product or a month adds data, not formulas or sheets. Scenarios are another dimension of the same model, so every scenario uses the same logic and can be compared side by side.
Two examples from our own work:
- Petroleum project economics (SPE-174768-MS): one table covers 96 project cases with 11 formulas instead of 1,056 in the spreadsheet version.
- Port operator reporting: one Quantrix matrix replaces 128 Excel sheets (video below).
How large can a Quantrix model get?
We built a retail budget (240 stores, 30 subcategories, 52 weeks, 3 years, 3 scenarios) and then grew it without changing a single formula:
| Size | Stores × subcategories | Cells | Full recalculation | File size |
|---|---|---|---|---|
| Demo (free with the trial) | 240 × 30 | 33 million | 37 seconds | 60 MB |
| Large | 480 × 50 | 107 million | 108 seconds | 180 MB |
| Extra large | 750 × 155 | 500 million | 18 minutes | 743 MB |
All three ran on a laptop with 16 GB of memory; at 500 million cells Quantrix used 5 GB. A full recalculation is the slowest case: Quantrix recalculates only what a change affects, so a change in rent indexation took about 3 seconds at 500 million cells. Every size matched an independent recalculation to the euro. Read how the retail model works →
ways a model changes when it moves from Excel to Quantrix
Write Logic, Not Cell Coordinates
With Quantrix, you can write formulas in natural language instead of Excel formulas with cryptic cell coordinates. This makes your formulas easy to understand and audit.
Autocomplete helps you write formula faster. You have access to all the functions that Excel offers and more.
Goodbye Formula Chaos
In Quantrix, you do not place formulas inside each cell. You write the formula once, separately, and it applies across the matrix.
In the video, one formula calculates the gross margin percentage for every Port, Year, Month, and for both Actual and Plan data. This eliminates the need to write thousands of formulas as in Excel, which is a major advantage for large models.
From 128 Sheets to 1 Matrix
Quantrix Modeler lets you work with truly multi‑dimensional data — with always‑on pivoting that lets you slice, dice, and reshape data instantly. The single matrix shown on video, for example, replaces 128 Excel sheets, eliminating complexity and errors.
Quantrix is designed for high‑complexity, multi‑scenario models that would be difficult or unstable in spreadsheets.
No Copy‑Paste. No Errors.
Quantrix matrices have a connected structure. This example shows how adding a new Special Scenario in Assumptions automatically updates the Sales report.
You do not need to copy and paste items from one table to another like in Excel. This keeps your model structure consistent and error-free.
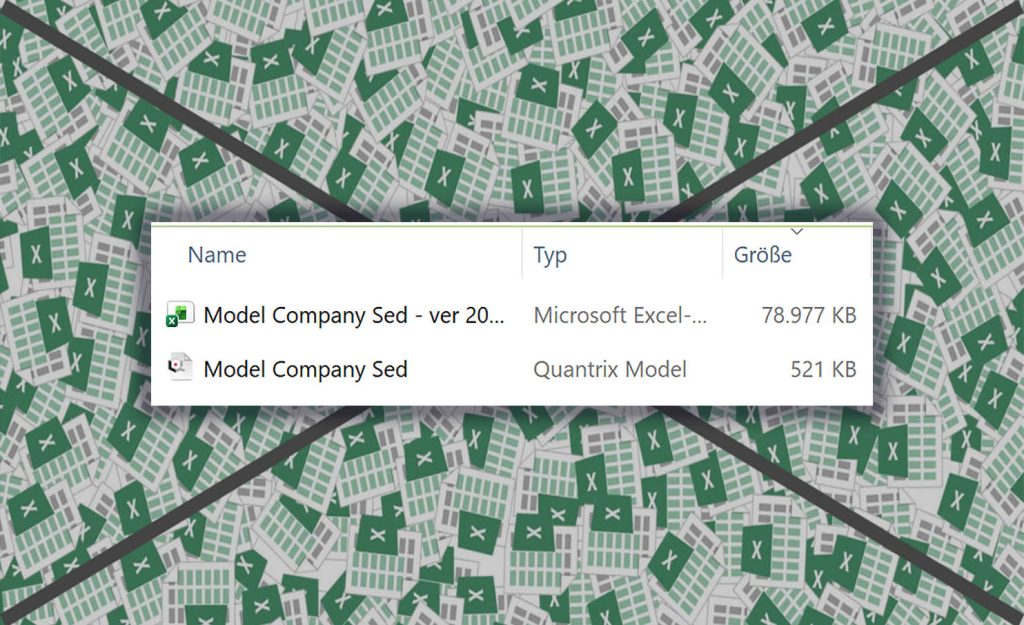
Big Models, Small Files
With Quantrix, you can work with millions of cells in one model without compromising speed or accuracy. Quantrix files are much smaller than Excel files for the same calculation. Plus, you can easily create and manage different scenarios or versions of your model and keep them all in one file.
Quantrix is the ultimate tool for complex calculations and data analysis.
Clear, Transparent Calculations
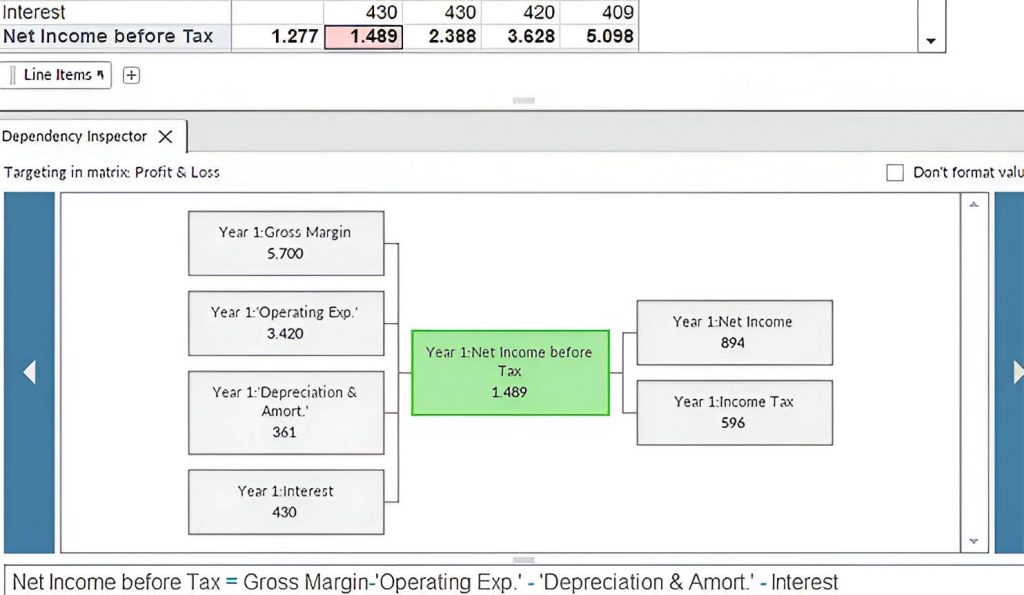
With the Dependency Inspector tool, you can easily see how each cell in your model is calculated and understand the logic behind it. This tool helps you to present your model confidently at your business meetings and explain how the numbers are derived.
The Dependency Inspector tool is a powerful feature that enhances the transparency and accuracy of your model.
Know Every Edit in Your Model
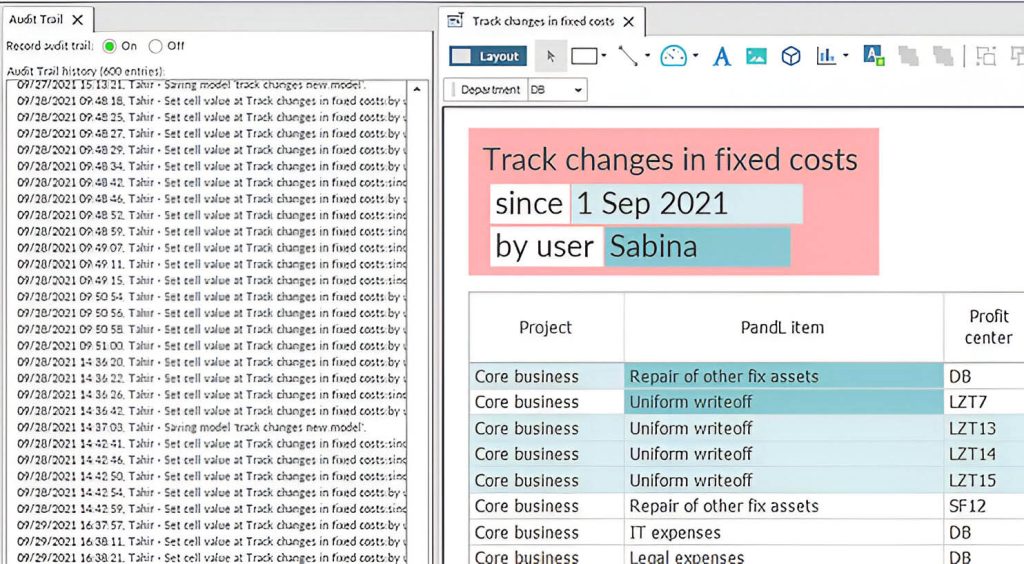
In Quantrix desktop app you can easily see who did what and when on your model.
Audit Trail tool records all changes to data and structure, so you can always go back and review them. Plus, you don’t have to worry about documenting of changes to your model, because it is done automatically. This is especially important if you are working on a shared model.
Visualize. Present. Impress.
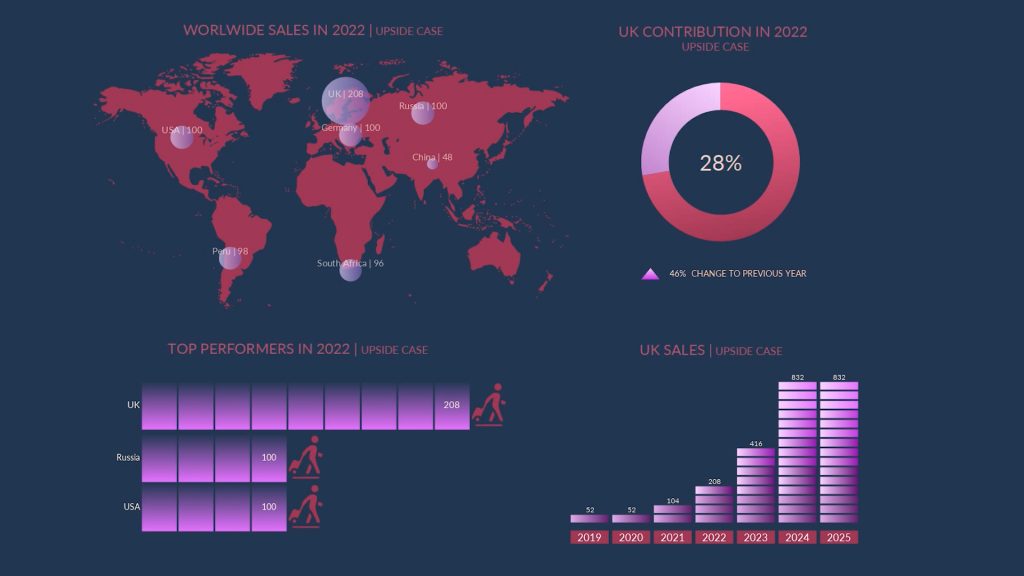
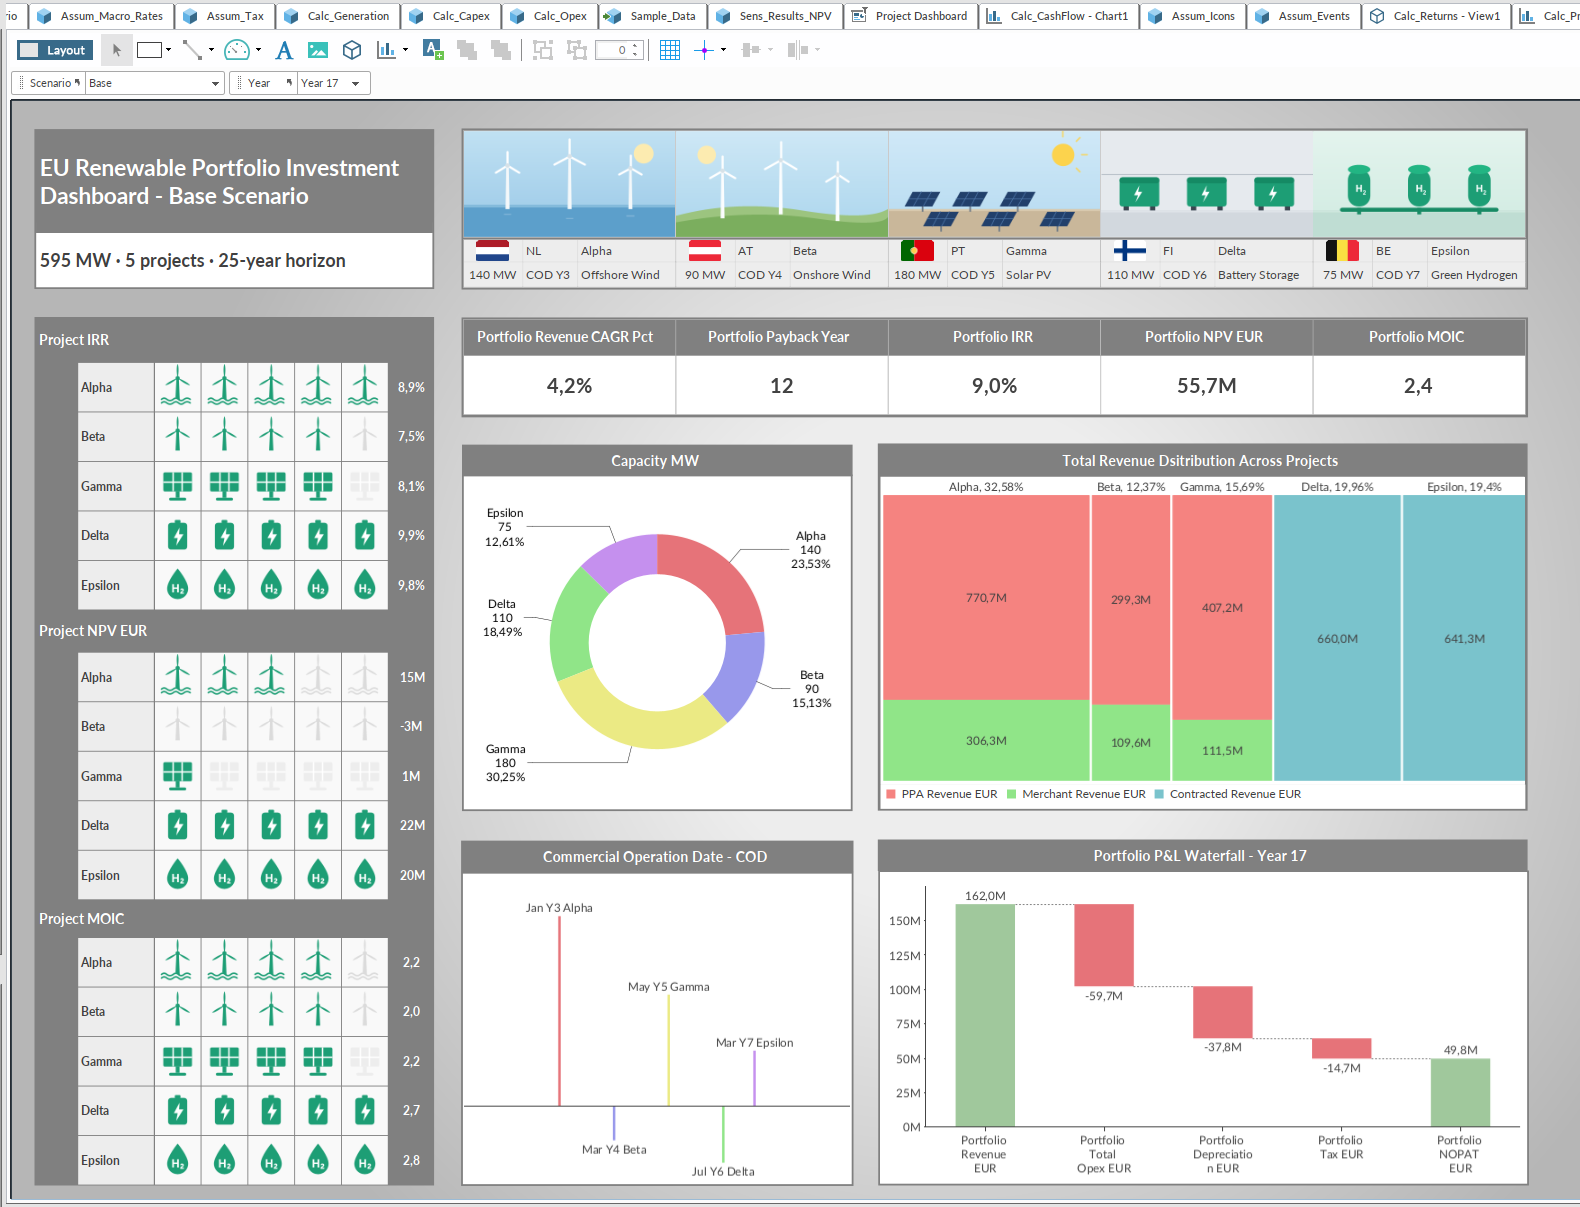
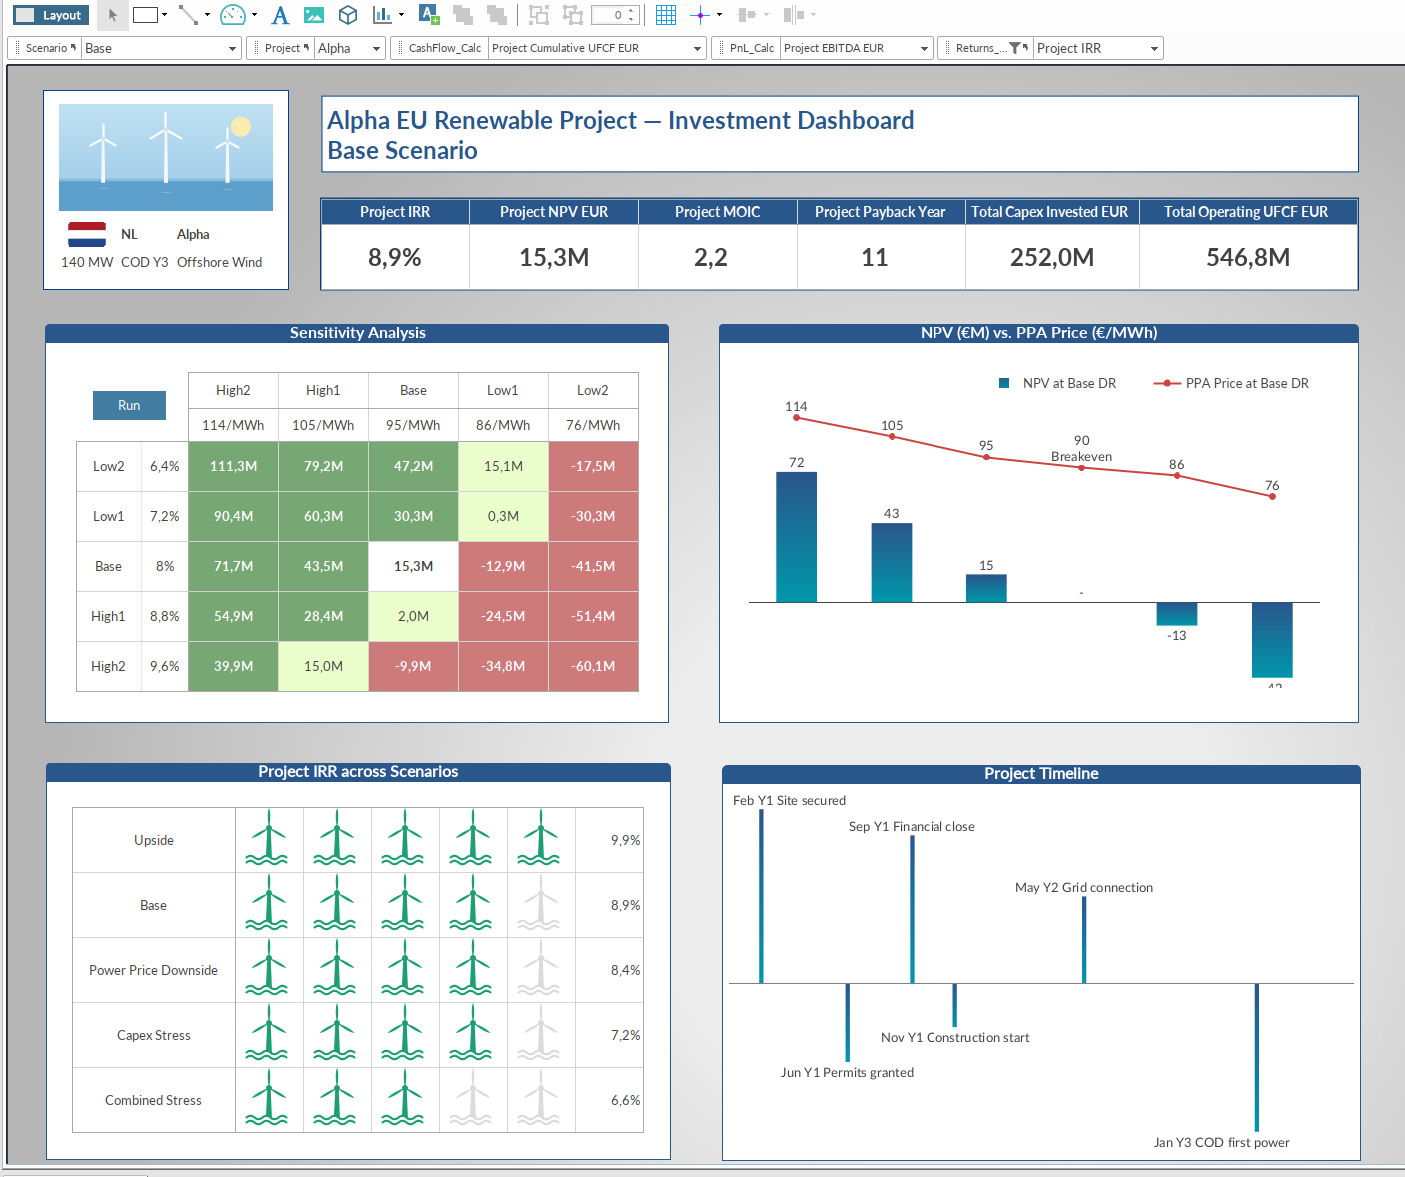
You can create amazing dashboards and reports with Presentation canvas. Just add your chart, data, images, interactive sliders and other widgets to the canvas and customize them.
With Presentation canvas, you can tell the story of your data in a visually appealing way that will impress your audience.
When should you stay in Excel?
When the model fits on a few sheets, has one or two dimensions, is built once and rarely changed, or has to be edited by many people who only know Excel. Quantrix pays off when the model is reused every month or year, has three or more dimensions, needs scenarios, or has to be explained and audited.
How do you move an existing Excel model?
- Identify the dimensions hidden in your sheets (products, regions, months, scenarios)
- Rebuild the logic as a few formulas per matrix; the data comes in from Excel or CSV
- Run both versions side by side until the results match
We can build the first version with you, or from a written brief with our AI model builder. See model examples →
Smart Modeling Solutions e.U. is an Official Quantrix Partner in Europe. Tahir Tahirov has built planning and project-economics models for 20 years and is the author of SPE-174768-MS.
Showcase of Quantrix Models





Frequently Asked Questions about Quantrix Modeler
Get Full Access to Quantrix – Free for 30 Days
We ask for a few details to send your download link and help you get started. Your info stays private, no spam, no credit card.
Why It is Worth Your Time: