This article will introduce you a new, innovative way of financial modelling for your planning, budgeting, forecasting needs and running “what-if” analysis with multiple scenarios. Every controller faces complex modelling tasks in his/her daily work. Be ready to sit on driving seat, quickly and efficiently create your financial model.
Multidimensional modelling is an alternative to costly ERPs or Traditional Excel Spreadsheets for your budgeting and planning needs
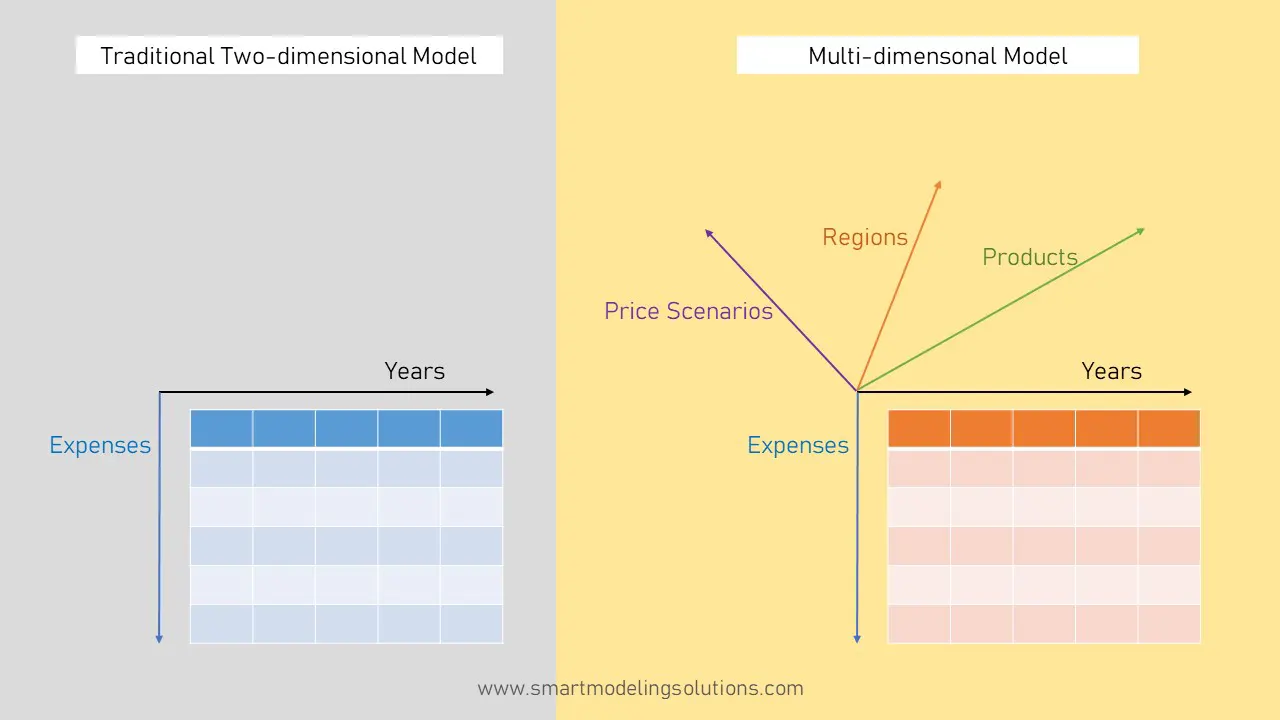
Let us start with a simple example. Imagine that you need to model P&L over the months for 50 business units. In a standard two dimensional world you would need to have 50 spreadsheets (1 per BU). Instead of creating separate P&L spreadsheet for each business unit, you create a 3-dimensional cube with all P&L items, business units and months inside, where the P&L items and months, once created are shared across business units. 50 business units could be 50 projects, plants, departments, regions, products, etc.

Fig 1. Move from 2D to 3D World
This means you do not need to repeat the same work for each business unit:
Let us move to the next step. You need to model also cashflow for your business units. Here comes the greatest advantage of multidimensional model, namely its linked structure. So, we have a P&L cube and we need a second cube - Cashflow. They share same dimensions: Months and Business units. For building cashflow cube you use existing dimensions of months and business units from P&L cube. You can simply drag and drop those existing dimensions and build a structure for Cashflow cube. This is much faster modelling technique. Those dimensions are automatically linked. If you add a new month or a new business unit in Cashflow it will be added in P&L immediately, or vice versa. It helps to maintain structure across models, simplify the model and eliminate errors. You can also change the layout of your financial statement and show results for particular month or business unit. Imagine turning a cube and showing different sides of it.

Fig 2. Linked structure in multidimensional model
In the following example we have Years and Scenarios linked between P&L and Cashflow in the multidimensional modelling software. New year or scenario added in one statement replicates in another.

Fig 3. Live example of linked structure in the software
Moreover, you do not need to copy and paste a formula for newly added item. Here we come to the next important step of multidimensional modelling technique – adding logic. But first let us summarize important aspects of structure of multidimensional model:
Data and formulas are separate in this modelling concept. It means one formula, written in natural language applies to the whole range of business units or months not to the particular cell. The EBIT formula syntax looks like this:
EBIT = Revenue – COGS – Operating Expenses
This formula is much easy to understand and audit compared to cryptic formula with cell coordinates in two dimensional spreadsheets. This single formula work for all business units and months. If you have 50 business units and 12 months you would need to repeat this formula 600 times in a traditional spreadsheet (50x12).
Since formulas and data are separate, user cannot overwrite a formula or number. The big risk factor of using spreadsheets is human error by data entry. Entering a number in the formula cell – hardwiring - is very common in a traditional spreadsheet.
In the following example we have 5 dimensions. So that to calculate sales forecast for all Years, Countries, Products, Currencies and Scenarios you need a single formula:
Years[THIS]=Years[PREV]*(1+Assumptions::Rate)
If you add a new year, country, product, currency or scenario to your model you do not need to write a new formula. This makes much easier and faster to run what-if analysis for a risk assessment. Look at the price scenario dimension. You just need to add a new item to it (e.g. high or low) and that is it - you will immediately see result.

Fig 4. Model with 5 dimensions and only 2 formulae to calculate. It is comparable to 216 formulae in cell based spreadsheets.
Let us summarize important aspects of adding logic, in other words writing formulae in the multidimensional model:
Formulae:
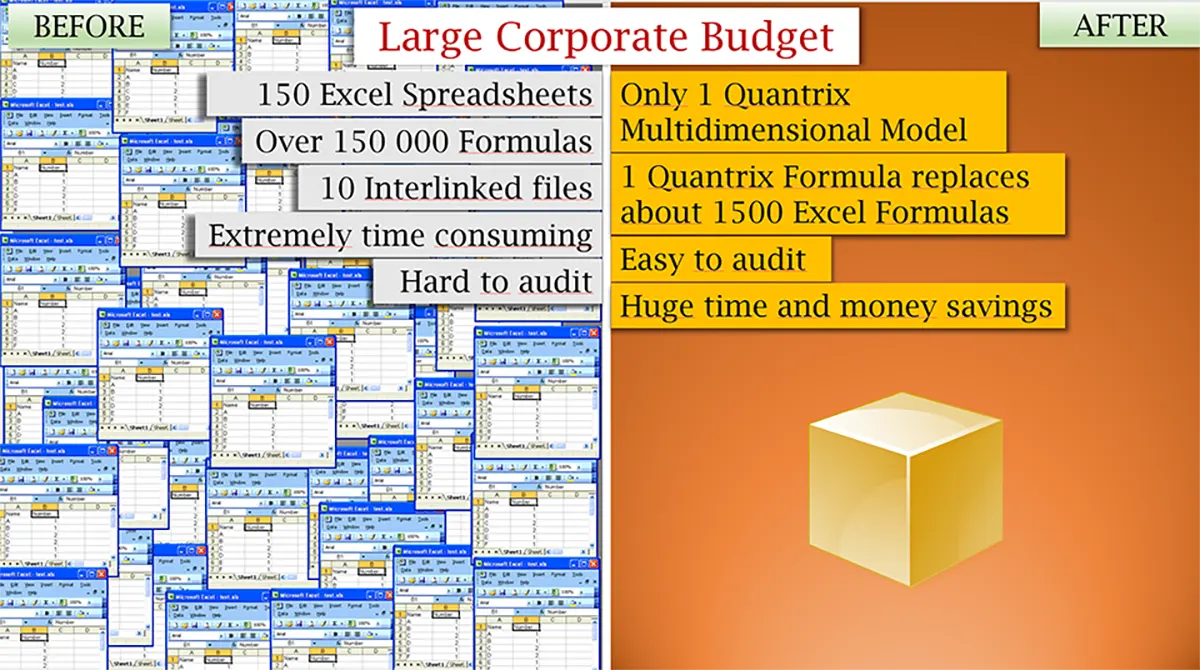
Multidimensional modelling works very well for complex planning, budgeting, reporting, scenario analysis, liquidity forecasting, analytics. For example, you may achieve transparent, easy to audit corporate budget model with much less formulas and simplified structure (based on real implementation project).

Fig 5. Real example of implementation of multidimensional modelling for corporate budget of a large concrete producer with 60 plants across the country.
If you add more dimensions to this cube, you will actually multiply your efficiency.

Fig 6. With a complex models efficiency gains increase exponentially
Multidimensional modelling gives you more flexibility to create your plans. At the same time you do not need to have programming skills to build the model. This allows to overcome many limitations of alternative solutions used for planning needs.
BI/Reporting applications and databases are suited to work with current or past available data. These applications do not support free form creation and modelling of data. In most cases, their functionality supports budgeting per accounting standards rather than true planning according to changing business dynamics. Implementation of such solutions can take a long time, especially when you need high degree of customization and extensive programming.
In the forecasting, planning, budgeting, evaluating projects we need to model data based on logic. In a database the “record” is the building block. In a forecast model “variable” is a building block, defined by logic in formula. Multidimensional modelling allows us to easily add this logic: variables, dependencies, factors, drivers, etc.
Each of us probably faced a problems of large and complex spreadsheet: broken links, errors, large file size, etc. This undermines confidence in the data and insight they produce.
When we work with traditional spreadsheets it is hard to find out which cells hold what kind of data. Input, intermediate and output values quite often mixed in the sheet, formulas and data are mixed in the cell. Changes of the layout of the sheet can make the entire model non-functional. The ramifications of errors can be disastrous to organizations, like the most recent case with a spreadsheet error which led to £150m Edinburgh hospital opening delay.
Very often controller spend significant amount of time of unproductive work to find and fix errors, instead of concentrating on analysis which adds value and produce important insights for decision makers.
Multidimensional financial modeling helps you save time by creating driver-based planning models that are easy to audit, flexible. It provides quick and easy scenario analysis.
Multidimensional modelling has its roots in Lotus Improv2 which disappeared in the 1990s. But the program is fondly recalled in the industry. The most notable software solution which based on concepts of Lotus and still on the market is Quantrix. It is a modern version of legendary Lotus.
Tahir Tahirov, PMP is a founder of Smart Modeling Solutions e.U. He has over 17 years international experience in petroleum, energy economics, financial modeling, software implementation, financial planning and analytics, budgeting and project management. He speaks 5 languages and has two MSc degrees in Business Administration and Energy Studies and PhD degree in Computer Science.
This website uses cookies to ensure you get the best experience on our website. Learn more