
November 2024
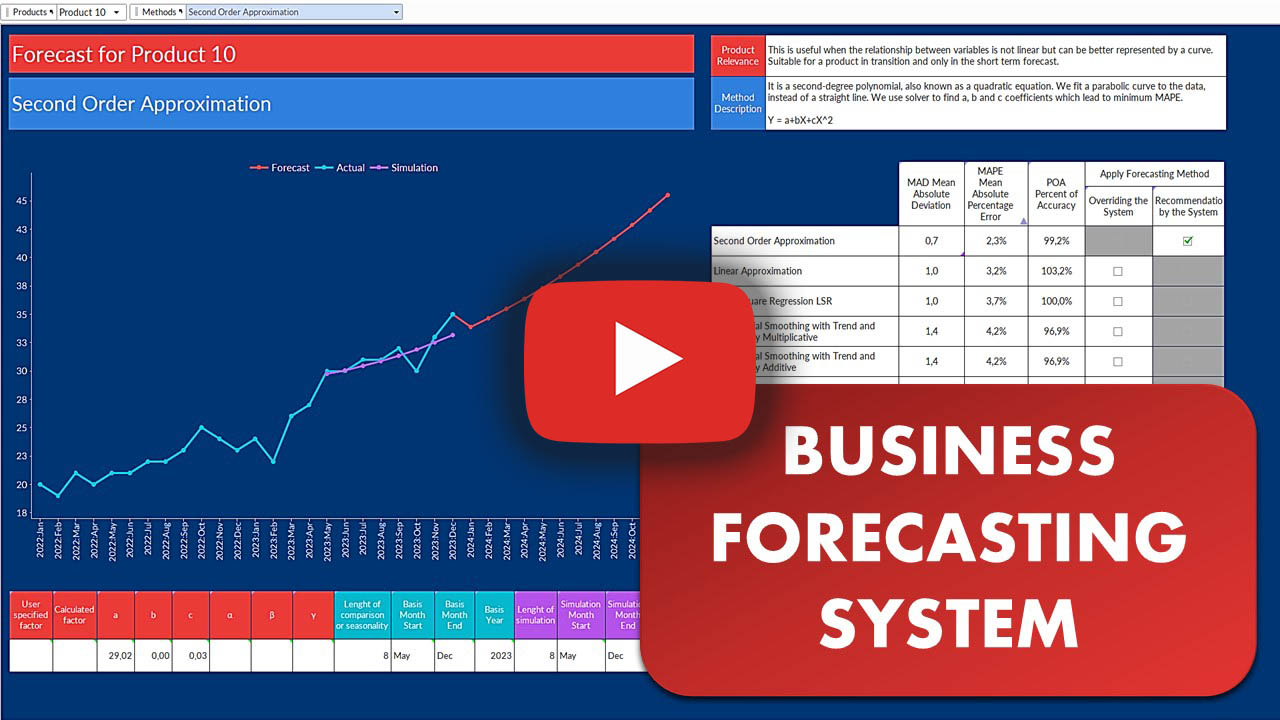
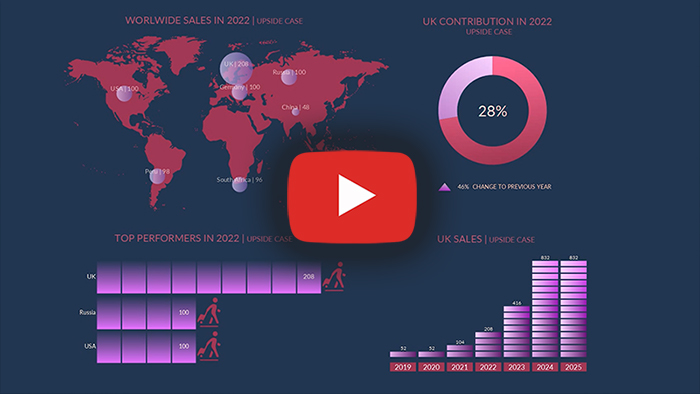
Dive into the world of business forecasting as I demonstrate the application of various forecasting methods using Quantrix. Learn about Simple Historical Forecasting, Moving Averages, Exponential Smoothing, and Regression Analysis. These methods offer a great mix of simplicity and efficiency, suitable for many typical business forecasting needs.
Widely used across sectors like retail, manufacturing, finance, and supply chain management, these techniques help companies predict future trends, optimize stock levels, reduce waste, and enhance customer satisfaction. Additionally, I show you some key metrics to assess and improve the accuracy of our forecasting methods.
September 2024
To enhance the filtering process and provide an option to show all items, user can consider adding an “ALL” item to the dropdown list (this can be done via the generate items feature). When a user selects “ALL,” the entire table will be displayed. This approach may be more intuitive for users, as they will not need to clear the dropdown selection to view the full table.
Additionally, if a user have multiple filters, combining them with a “Show All” button can further improve usability by resetting all filters at once. A user can also dynamically aggregate data based on the selected items in the dropdown menu.
June 2024
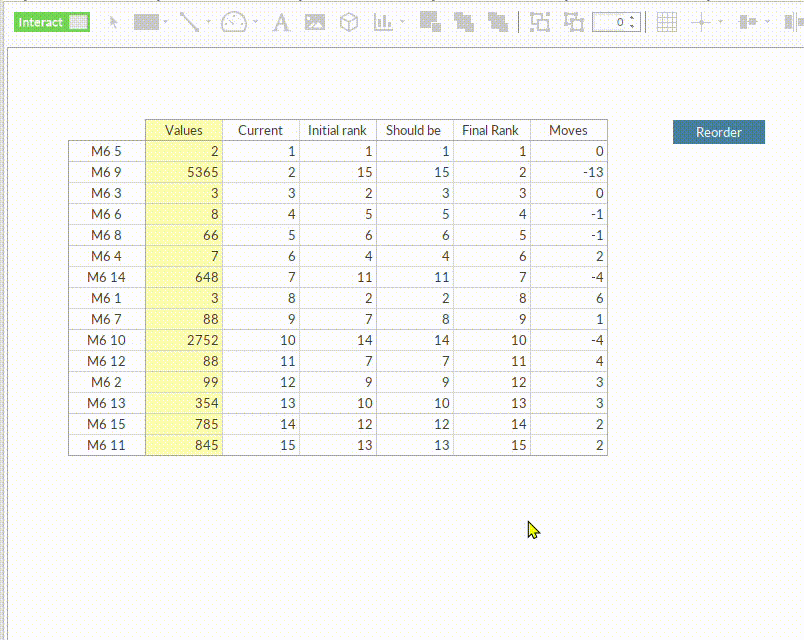
It is possible to reorder items based on values via script (an example shown below). It should be clear that in a sorted matrix, Quantrix sees only original (unsorted) item position (index). One can check it by adding item with #category formula in the sorted matrix. So, concept of sorting and reordering somehow different. Contact us to learn more
May 2024
Financial forecasting is a crucial process for any business that wants to plan ahead and make informed decisions. Financial forecasting involves making financial projections based on data, trends, assumptions and scenarios to estimate the future performance of your business.
Read more >>
February 2024
Financial modeling software solutions are tools that make financial modeling easier, more efficient, and less resource-consuming. Financial models are numerical representations of a company’s operations in the past, present, and future. Benefits of using financial modeling software solutions are:
Read more >>
December 2023
Here are common mistakes to avoid when choosing budgeting software:
Read more >>
September 2022
Excel is a powerful and popular spreadsheet software, but it also has some problems and limitations that can affect its users, especially those who work with large data set. Some of the common problems of Excel are:
Read more >>
July 2022
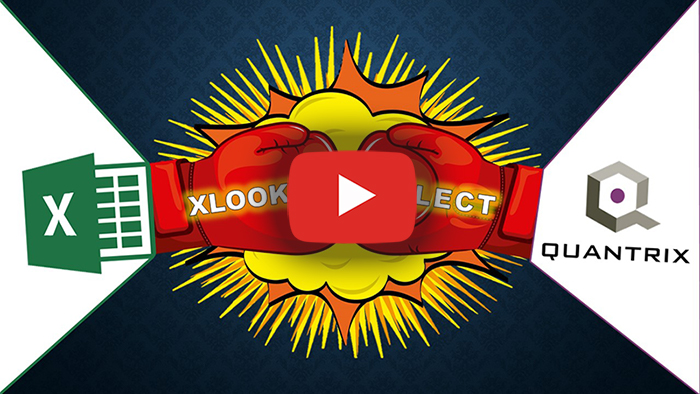
XLOOKUP is promised to be the only Excel lookup function you need, mostly replacing VLOOKUP and INDEX & MATCH. But it has problems which I outline in this video.
I cover 4 problems of Excel XLOOKUP and compare it to SELECT function of Quantrix Modeler.
May 2022
This almost 30 years old article promises that Lotus’ Improv for Windows will change the way people create and look at spreadsheets. With Excel dominating the market, these amazing advantages of Lotus Improv are almost forgotten. But they are still valid today.
Luckily, we have all these amazing concepts of Lotus Improv in Quantrix for those who want to #gobeyondexcel

Jan 2022
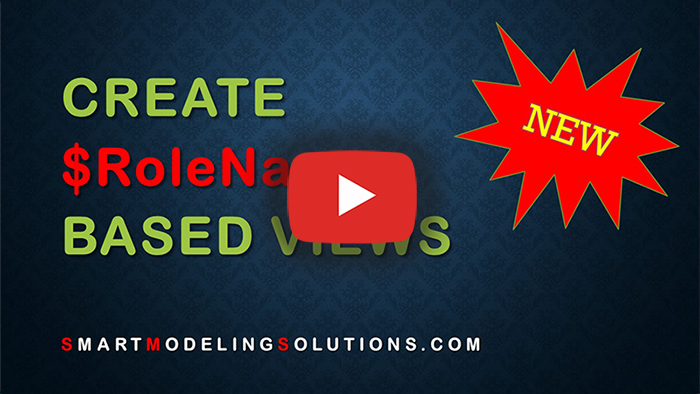
I think the most interesting way of using role names is in creating different views of the same Matrix based on the role. This means users with different roles will see different parts of the matrix assigned to them. We can do it by using the role name variable in filter expression. You save your time because you do not need to create a separate matrix view for each user.
Jan 2022
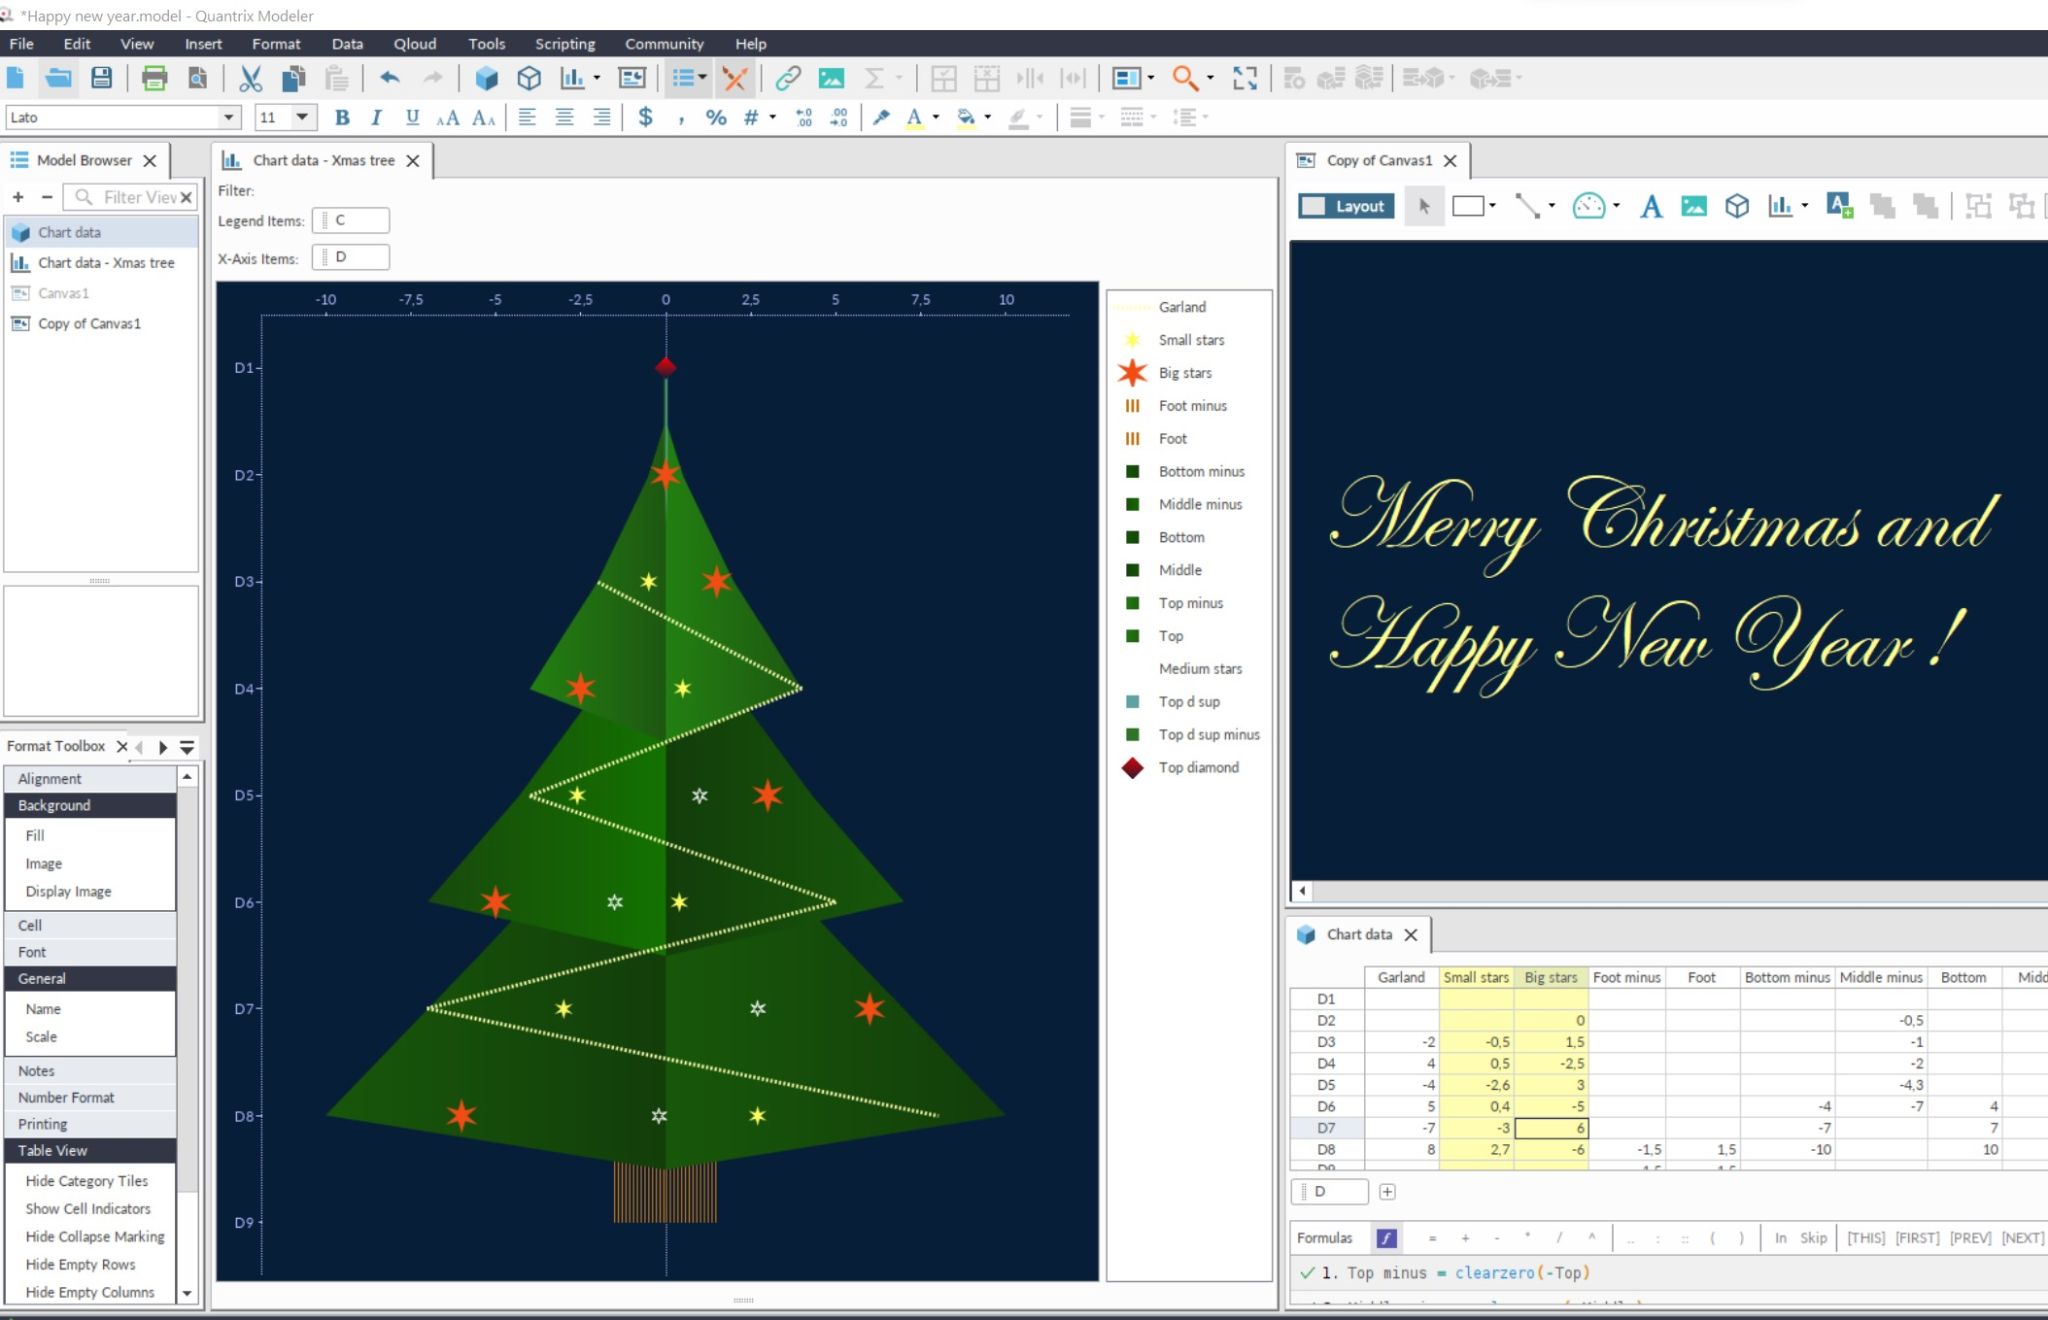
Wishing you high values of Happiness, Love and Joy in 2022. This time with a Christmas tree chart (!) created in Quantrix #love #happiness #gobeyondexcel
Sep 2021
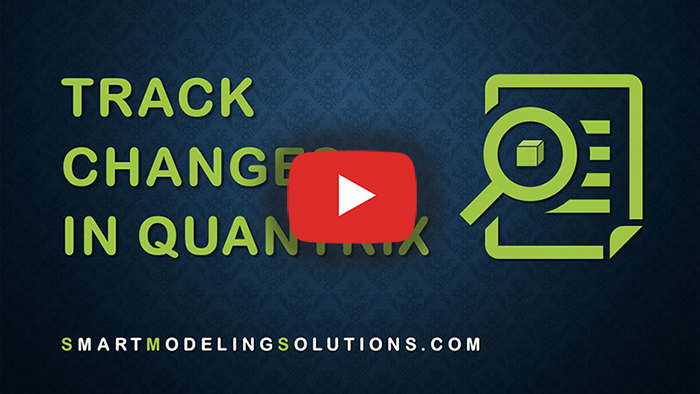
Show changes directly on the matrix along with the date and user name using data from Audit Trail. This feature significantly increased transparency and enhance my model audit capacity. If you are interested to learn more how to do that, or you think it could be a useful within your organization, please let me know.
Sep 2021
In diesem Artikel wird eine neue, innovative Methode zur Finanzmodellierung für Ihre Planung, Budgetierung, Prognose und Durchführung von Was-wäre-wenn-Analysen mit mehreren Szenarien vorgestellt. Link zu Fachbeitrag
May 2021
0:00 Вступление - Таир Таиров, Smart Modeling Solutions
6:11 Использование Quantrix для стратегического планирования в банке - Михаил Прозоров, ПАО "БАНК УРАЛСИБ"
30:10 Использование Quantrix для ad-hoc анализа в банке, Алексей Романов, ПАО "БАНК УРАЛСИБ"

May 2021
0:00 Представление - Таир Таиров, Smart Modeling Solutions
01:20 Опыт внедрения Quantrix в TOO "Magnum Cash&Carry" - торгово-розничной сети №1 в Казахстане - Жибек Мамбетова, АССА, Заместитель финансового директора по финансовой отчетности и бизнес-процессам, ТОО «Magnum Cash&Carry».

May 2021
Использование алгоритмов расчета, возможности масштабирования моделей и визуализация с помощью иконок в Quantrix - Таир Таиров, Smart Modeling Solutions

May 2021
0:00 Представление - Таир Таиров, Smart Modeling Solutions
01:05 Создание сценариев в Quantrix - Rich Lopez, Quantrix Authority
May 2021
0:00 Представление - Таир Таиров, Smart Modeling Solutions
01:21 Roadmap 2021 Q2 and Q&A - Brad Hopper, Генеральный Директор, Quantrix
52:02 Заключительное слово - Таир Таиров, Smart Modeling Solutions
February 2021
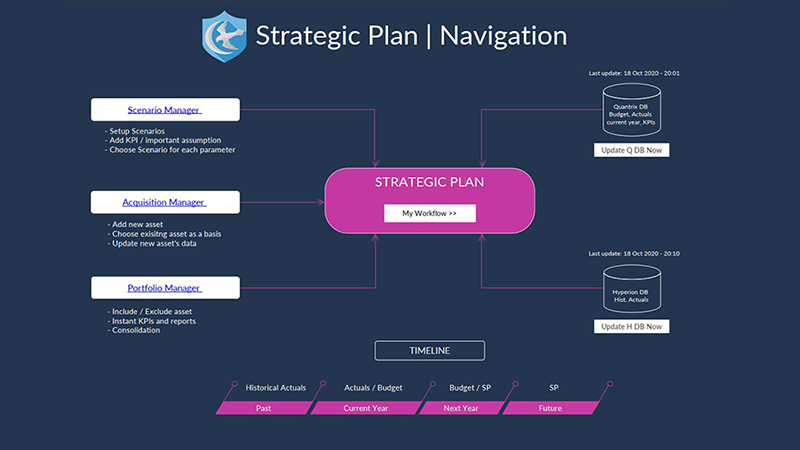
Check out our new video about building Strategic Plan in Quantrix which includes: Multiple scenario for each parameter, Acquisition manager with one-click asset addition and Portfolio manager for simulation and impact analysis.
Consider subscribing to our YouTube channel
February 2021
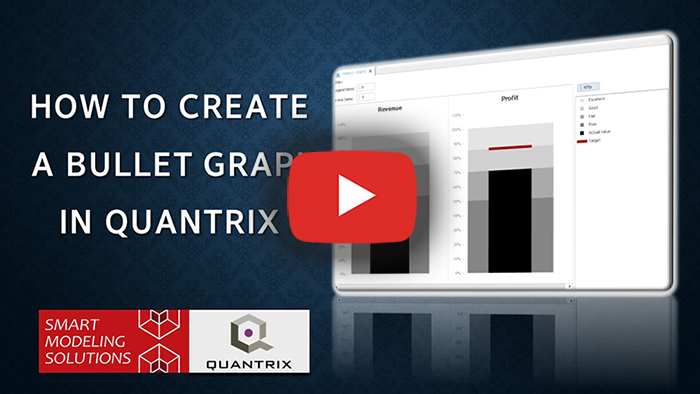
Watch step-by-step instruction for building a Bullet graph in Quantrix.
A bullet graph is a variation of a bar graph that shows progress towards a goal or performance against a reference line. A bullet graph consists of a featured measure (such as current revenue), a reference line (such as a target), and qualitative ranges (such as poor, average, and good) that provide context.
June 2020
Check out our new YouTube video about Dasboards: Sales, Customer Analytics, Budget vs. Actual.
Consider subscribing to our YouTube channel
June 2020
Getting started with Quantrix. In this video you will learn how to build multidimensional data model using Quantrix Modeler software. Step-by-step demo by Tahir Tahirov from Smart Modeling Solutions.
May 2020
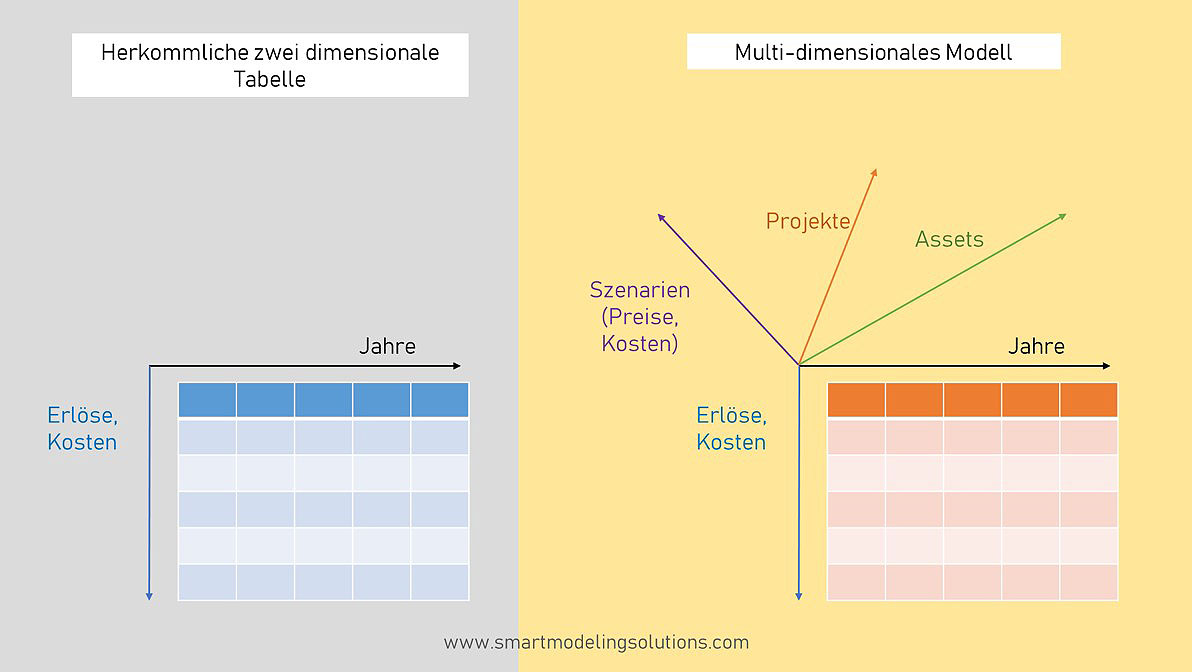
Quantrix is a powerful tool for data modeling and analysis. You can use Quantrix to create multidimensional formulas, scenarios, and visualizations. Quantrix lets you work with multiple categories and dimensions, while Excel is limited to rows and columns. Quantrix also has a natural language interface that makes it easy to write and understand formulas. Quantrix is a great way to explore and communicate your data insights.
Consider subscribing to our YouTube channel

May 2019
Our first major european Quantrix event was a great success with amazing users across Europe and beyond gathered in beatiful Vienna. We are proudly hosted this event. It was a great opprotunity to learn new skills and get the latest software updates and features. We had a city tour with old-timer Viennese tram and dinner at Heuriger Wine Tavern.
March 2019
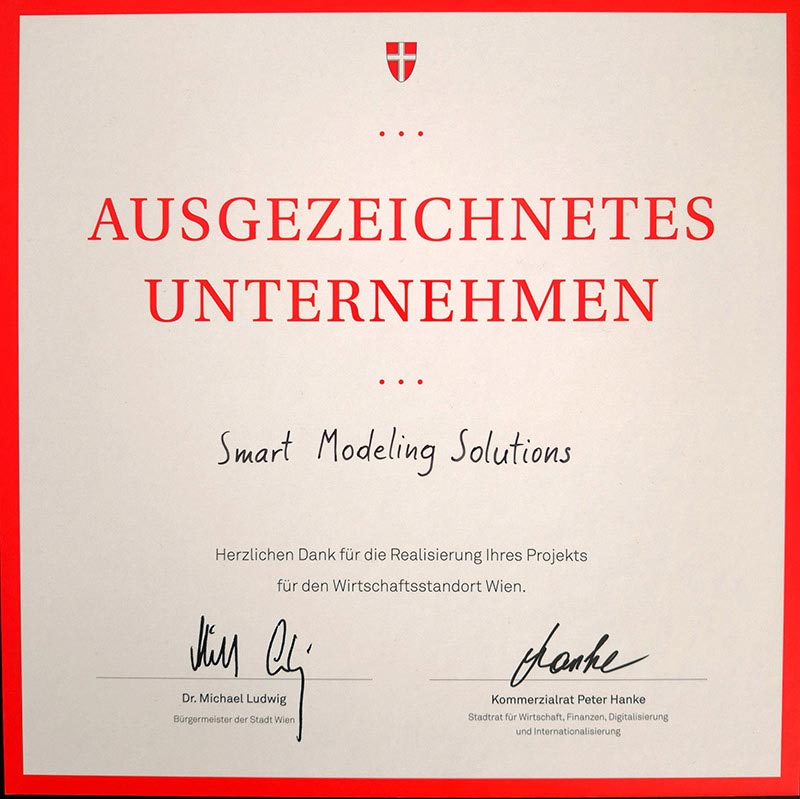
Für die Realisierung unseres Projektes, das zur Entwicklung des Wirtschaftsstandortes Wien beiträgt, wurden wir durch Bürgermeister Michael LUDWIG und Wirtschaftsstadtrat Peter HANKE geehrt! Danke Wirtschaftsagentur Wien für die Auszeichnung!
September 2018
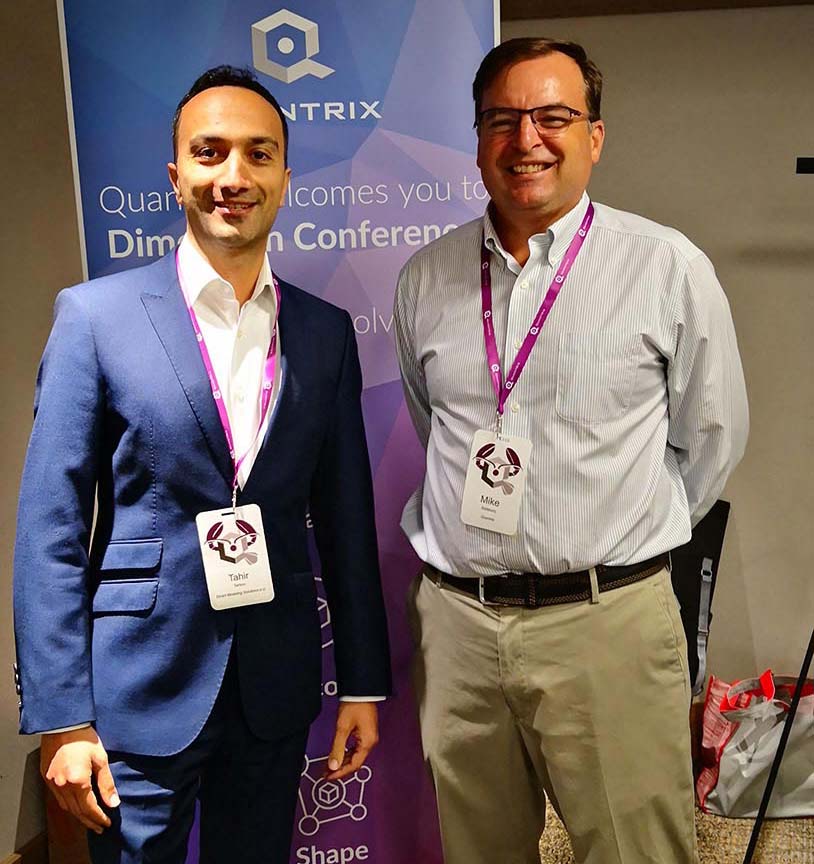
Every year Quantrix welcomes users and partners at the conference in a great city of Portland, Maine. Smart Modeling Solutions Founder Tahir Tahirov attended the conference and meet Quantrix Director Michael Salisbury. He and the whole Quantrix team expressed full support for our endeavors in Europe.
August 2018
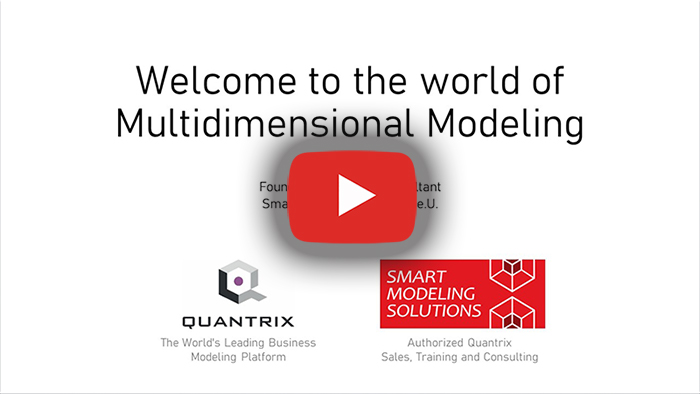
Multidimensional Modeling explained in simple terms. What is it? Why do you need it? How to implement it in your organisation?
Watch this video and get the questions answered.
June 2018
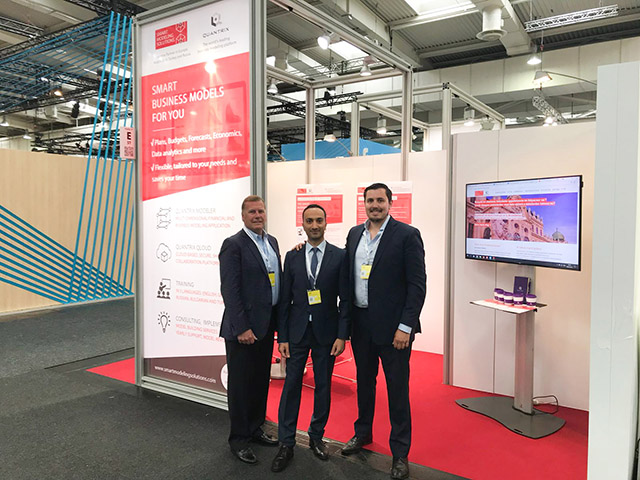
Quantrix together with Smart Modeling Solutions, Quantrix Reseller, Trainer and Consultant in Europe, Middle East and Russia participated as exhibitor in CEBIT 2018 (June 12-15, Hannover), Europe’s largest software event.
January 2018
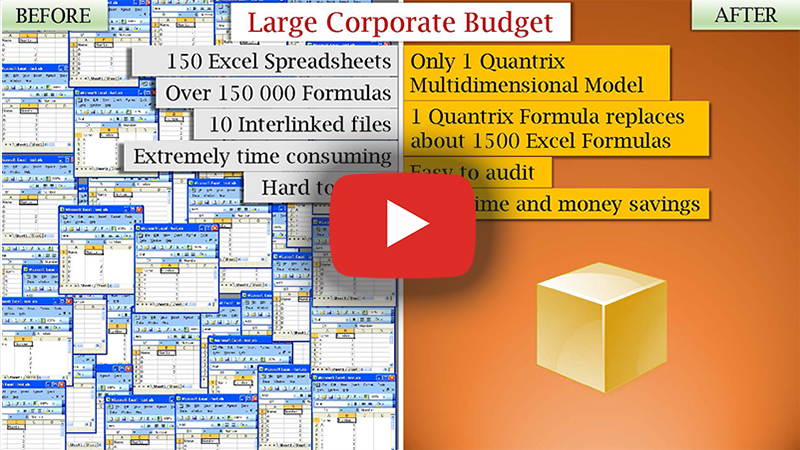
A success story of the company whose Large Corporate Budget including 60 Facilities in 6 Regions around the country was created using Quantrix Modeler and Smart Modeling Solutions services only in 10 days. Growing complexity of a business and consequently models has made using Excel not reliable option. Company has cut its budgeting time from 3 months to 10 days.
January 2018
Legendäre Lotus Software mit Quantrix wieder ins Leben gerufen. Diejenigen, die die Kraft der mehrdimensionalen Modellierung schätzen und ein bisschen Nostalgie für Lotus aus den 90ern haben, können sich Quantrix ansehen - ein modernes und leistungsstarkes Tool, das herkömmlichen Excel Tabellen weit überlegen ist.

This website uses cookies to ensure you get the best experience on our website. Learn more